The Food and Agriculture Organization of the United Nations recently released livestock slaughter data for 2017, as summarised in the table below.
Figure 1: Land animal slaughter numbers and meat production for 2017

The following chart shows trends since records began in 1961.
Figure 2: Trends for the period 1961 – 2017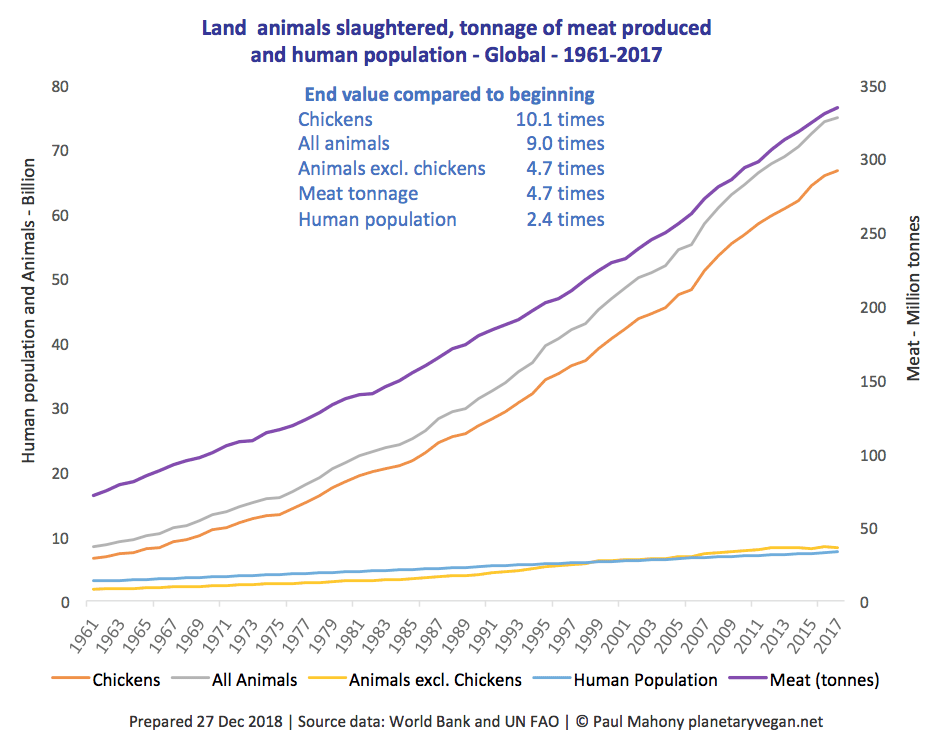
The numbers are horrific and mind numbing, including the overall slaughter rate of 2,374 animals per second.
Perhaps the only aspect that could be considered remotely pleasing is the fact that the growth in slaughter numbers and meat production has slowed.
Some key points:
- The rate of increase in the number of: (a) all animals (including chickens); and (b) chickens in isolation; are the lowest since records began in 1961. The figures are 0.9 per cent for all animals and 1.1 per cent for chickens. Over the past twenty years, they have been as high as 6.0 per cent and 6.1 per cent.
- The number of animals slaughtered, excluding chickens, declined for only the third time on record, with a reduction of 0.4 per cent. The only other years with reductions were 2013 (0.03 per cent) and 2015 (1.8 per cent), meaning that all three reductions have occurred in the past five years.
- At 1.3 per cent, the increase in the tonnage of meat produced was the fifth lowest on record, ahead of the corresponding figures from 1973, 1982, 1996 and 2001.
In terms of numbers, chickens are far and away the most tortured animal on the planet. They are slaughtered at a rate 45 times that of the nearest mammal, and suffer through all the cruelty that is part of the “production” process from birth till death.
Any trend to replace the meat from mammals such as cattle, sheep and pigs with chickens multiplies the extent of cruelty. Simply to replace the meat from the average bull or cow in the USA requires around 180 chickens.
Conclusion
Increasing awareness about the effect of animal-based food consumption on human and planetary health, and on the animals themselves, may be starting to have a favourable impact. However, that trend may be offset to some extent by increasing wealth in many developing nations, with a related increase in meat consumption.
Further details will follow, but in the meantime earlier charts and tables for various countries can be found on this site’s infographics page.
Author
References
Refer to Figures 1 and 2.
Image
The Aussie Farms Repository, Red Deer on a farm in North-East Victoria, Australia, aussiefarms.org.au
