Here’s a selection of infographics covering various issues.
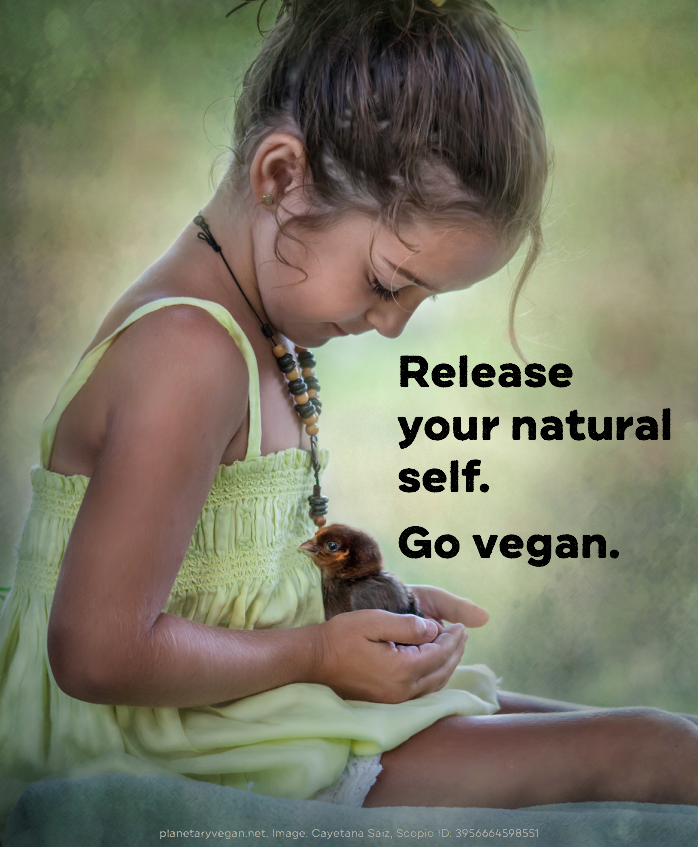
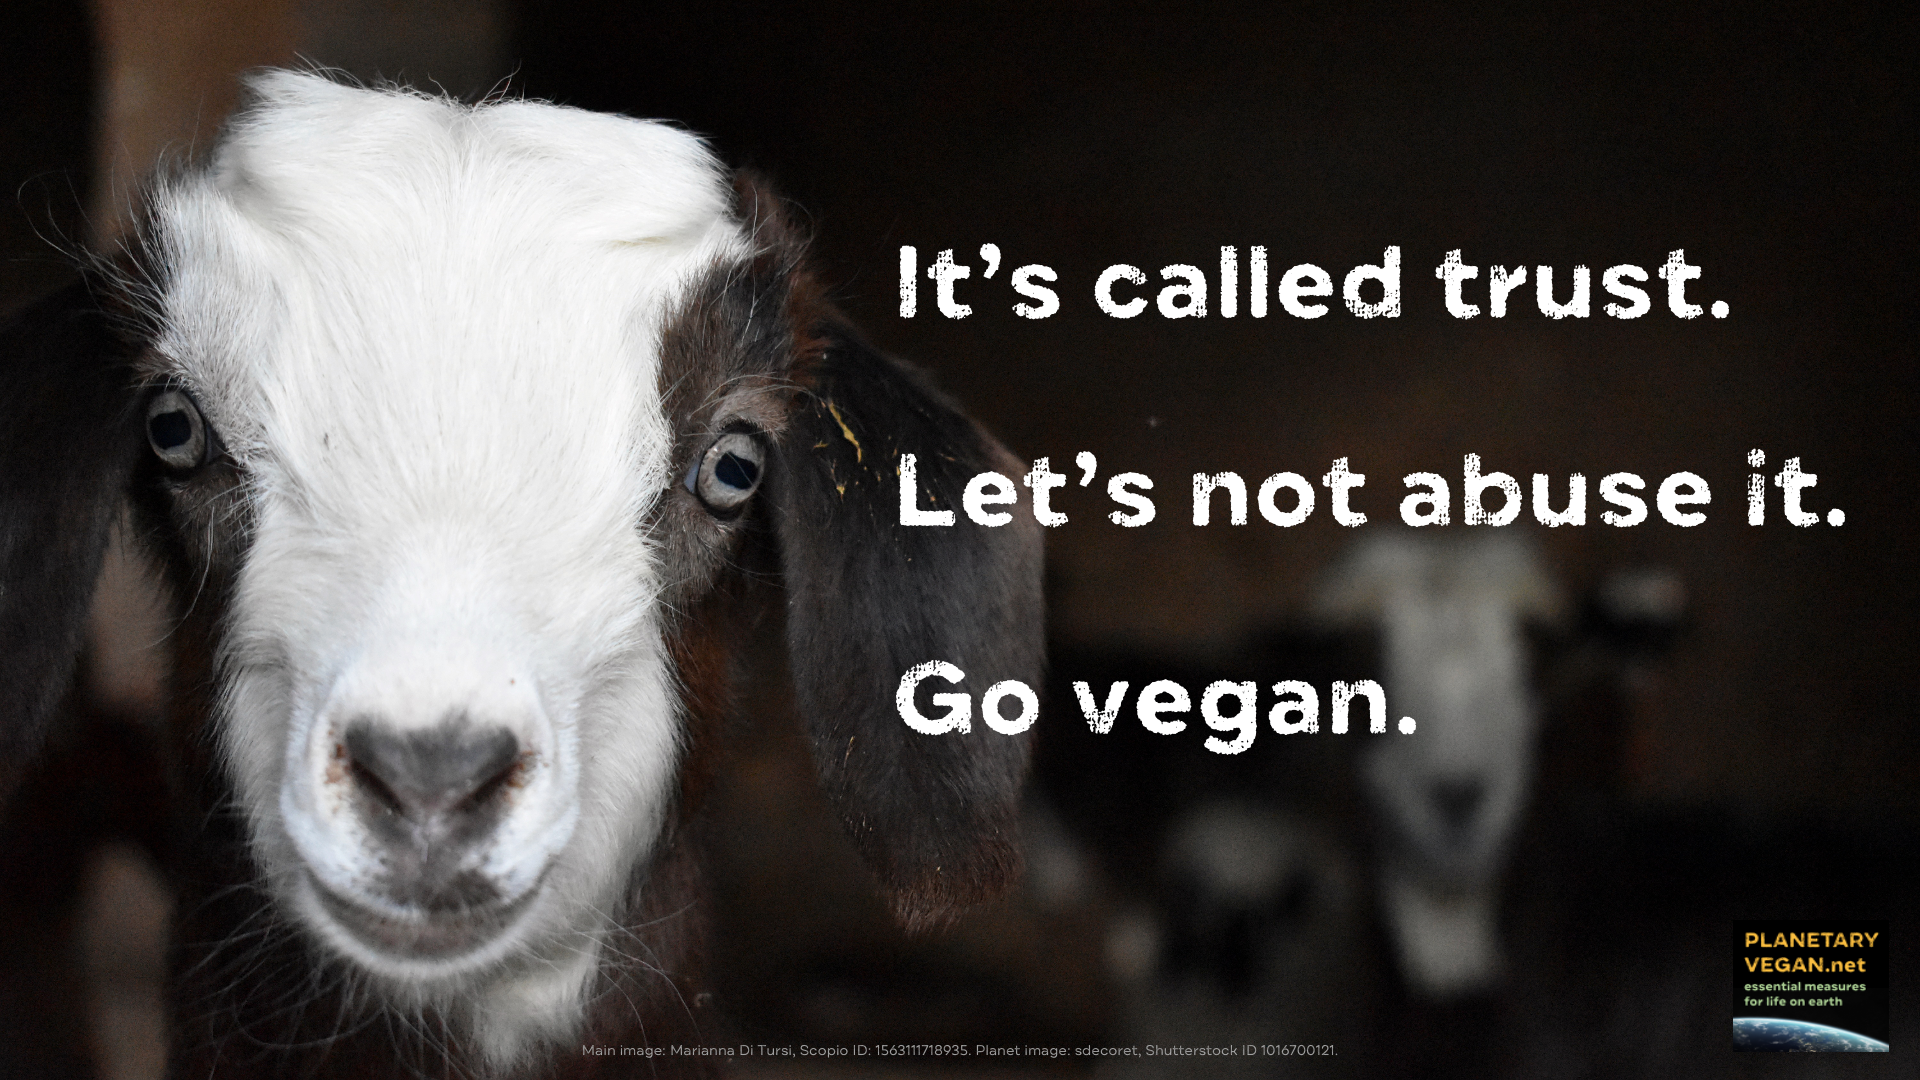
GOING VEGAN
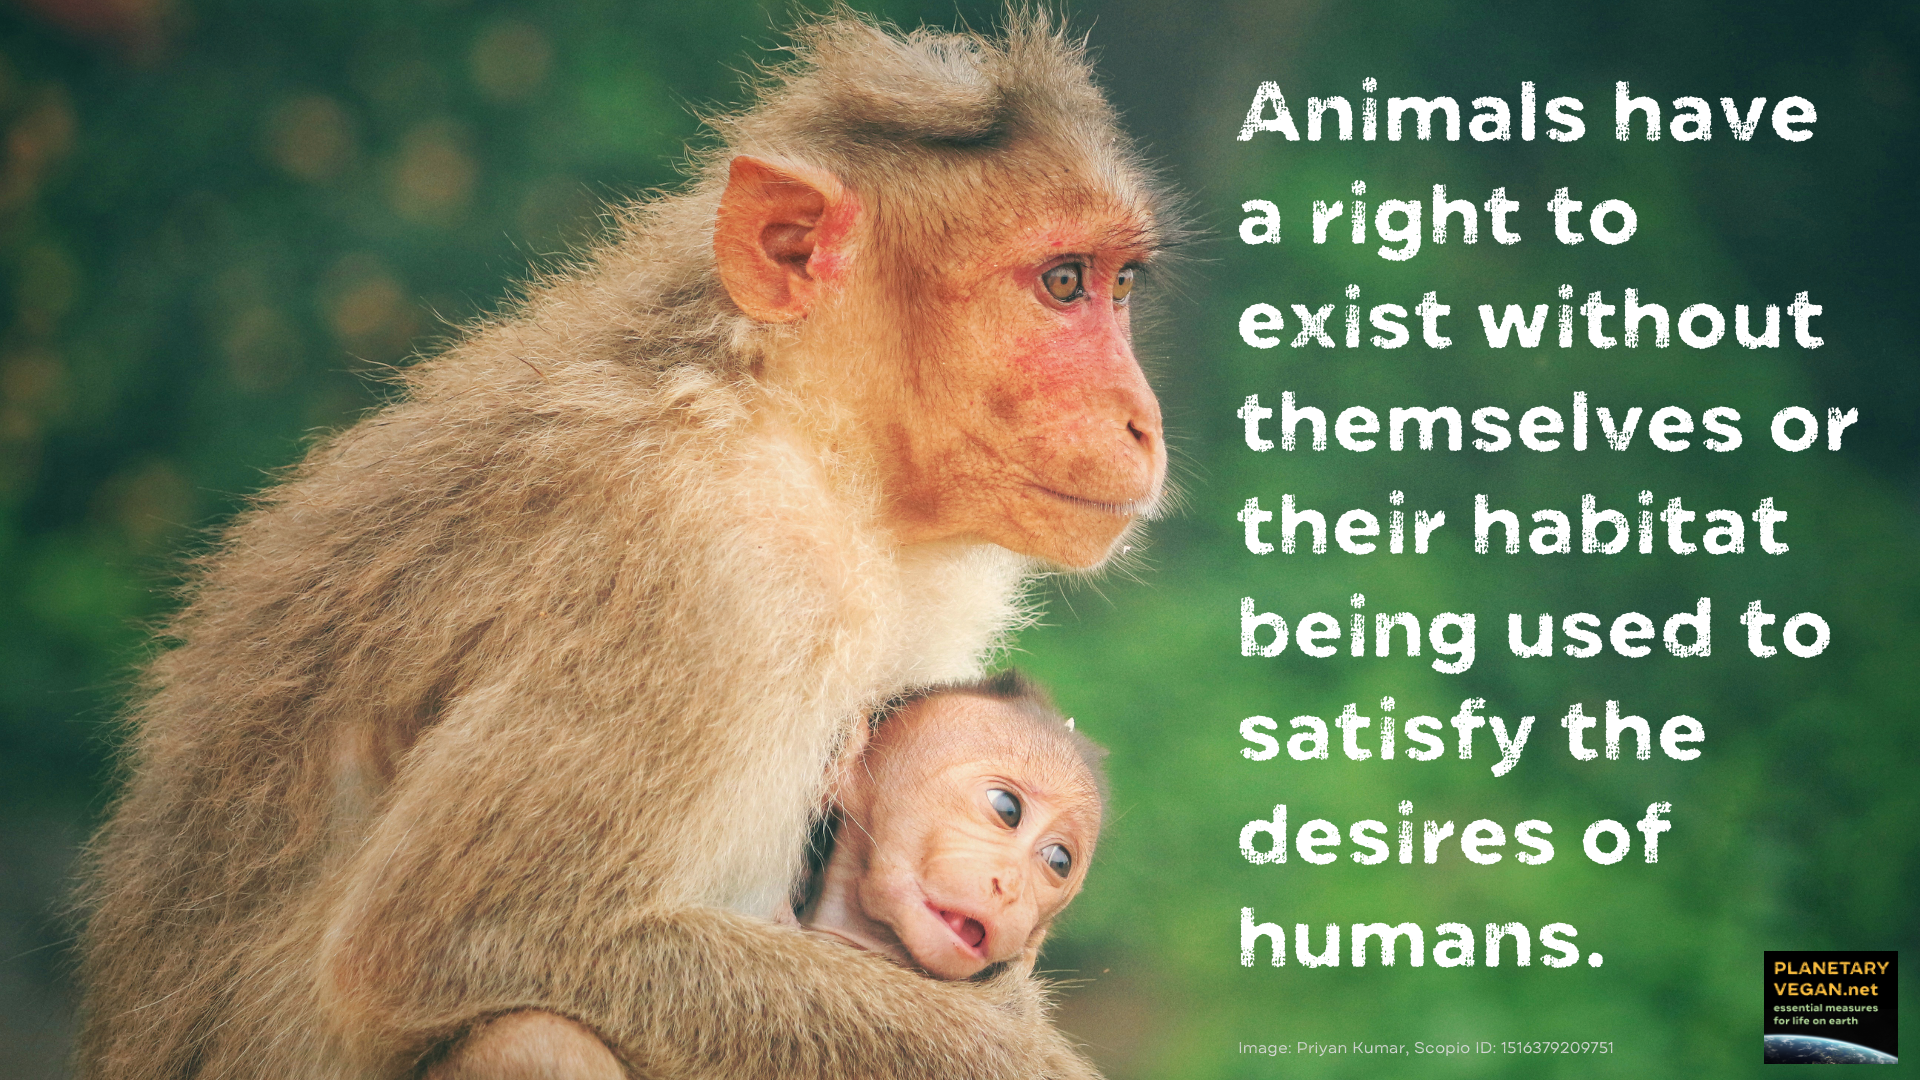
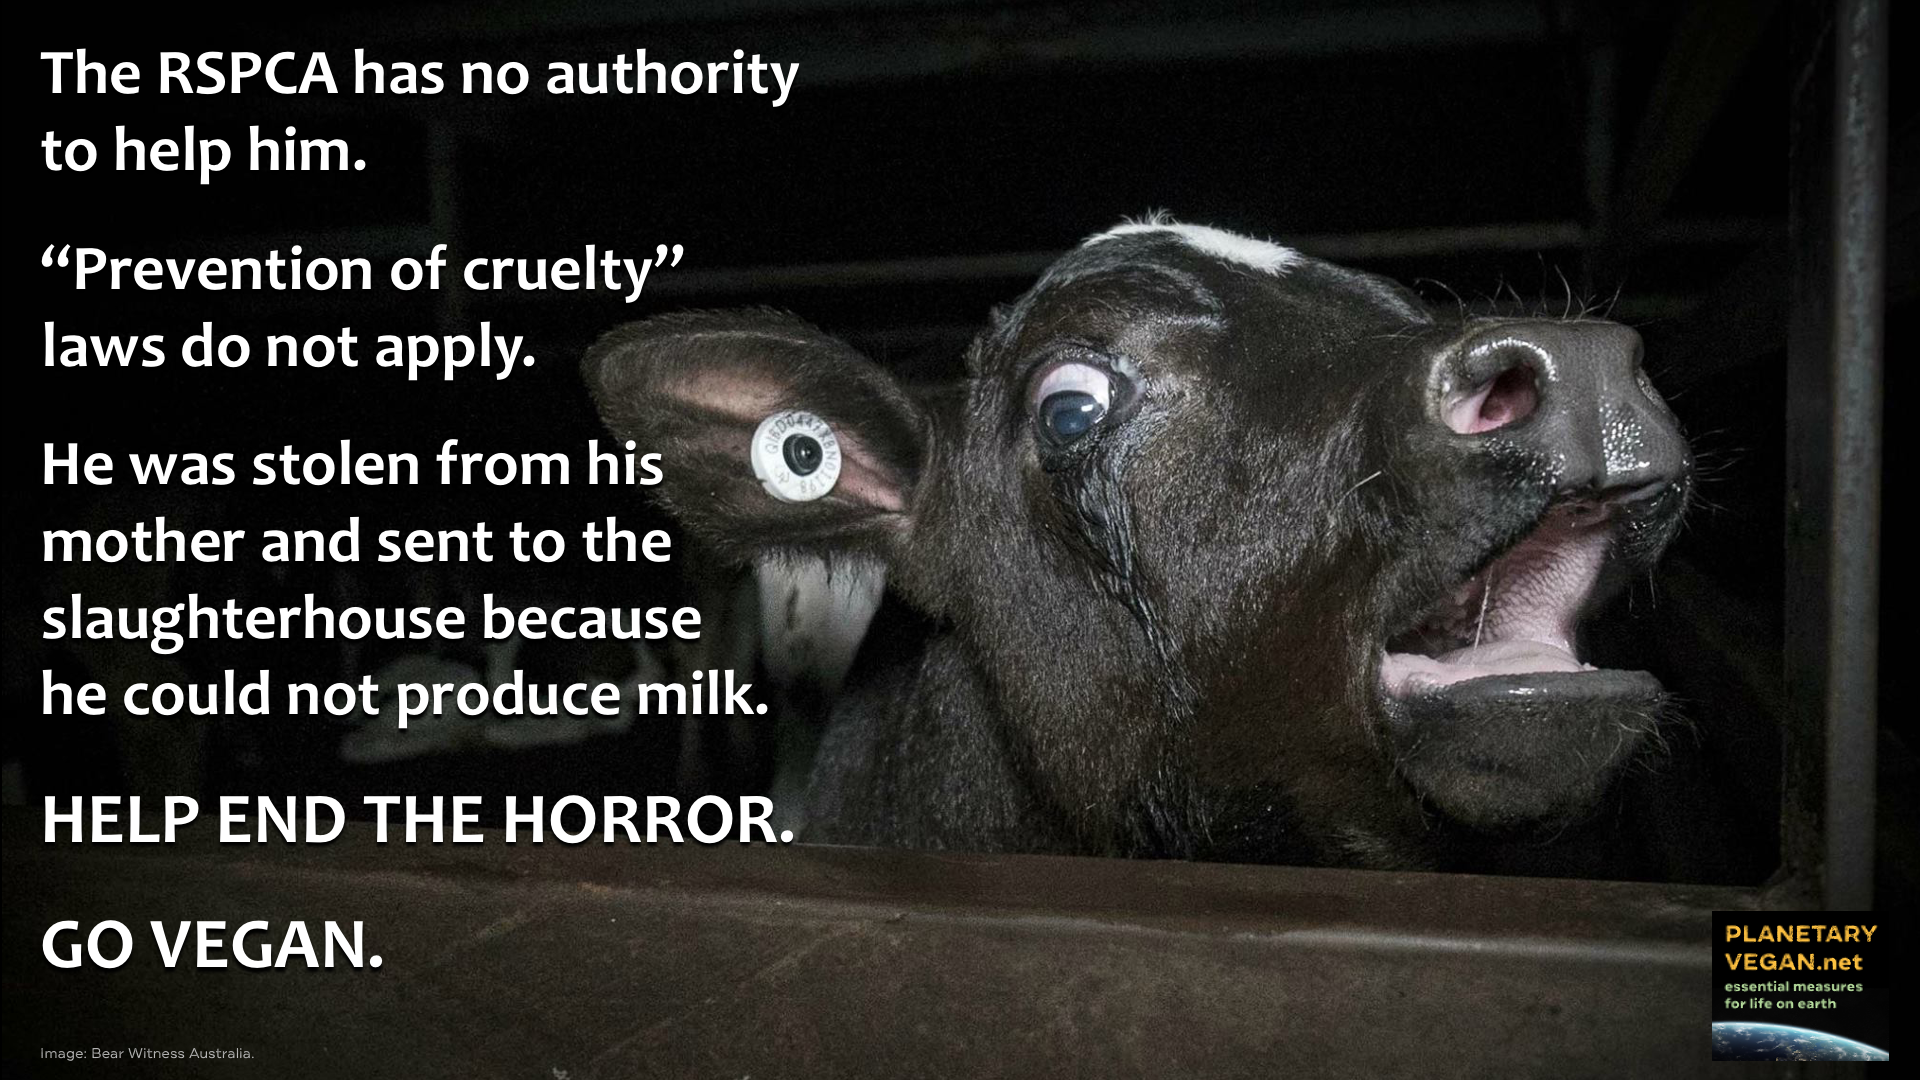
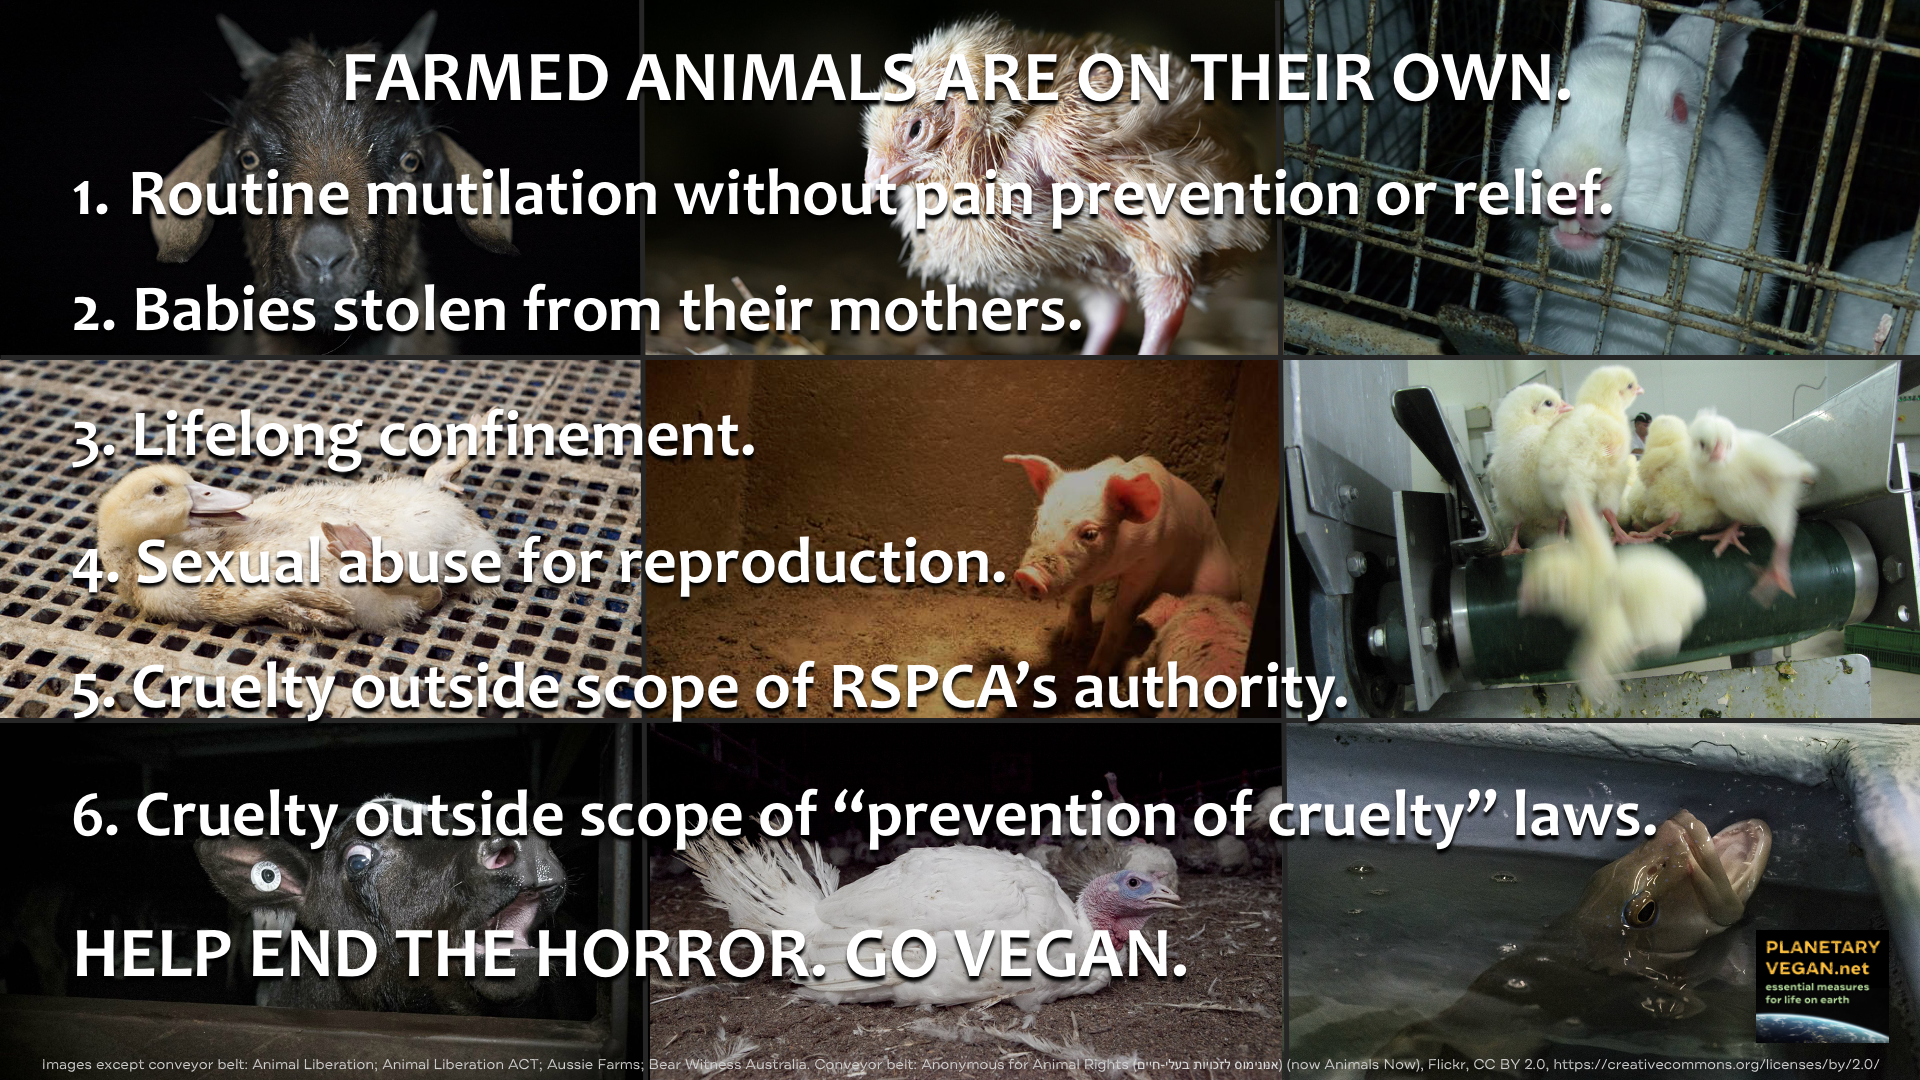
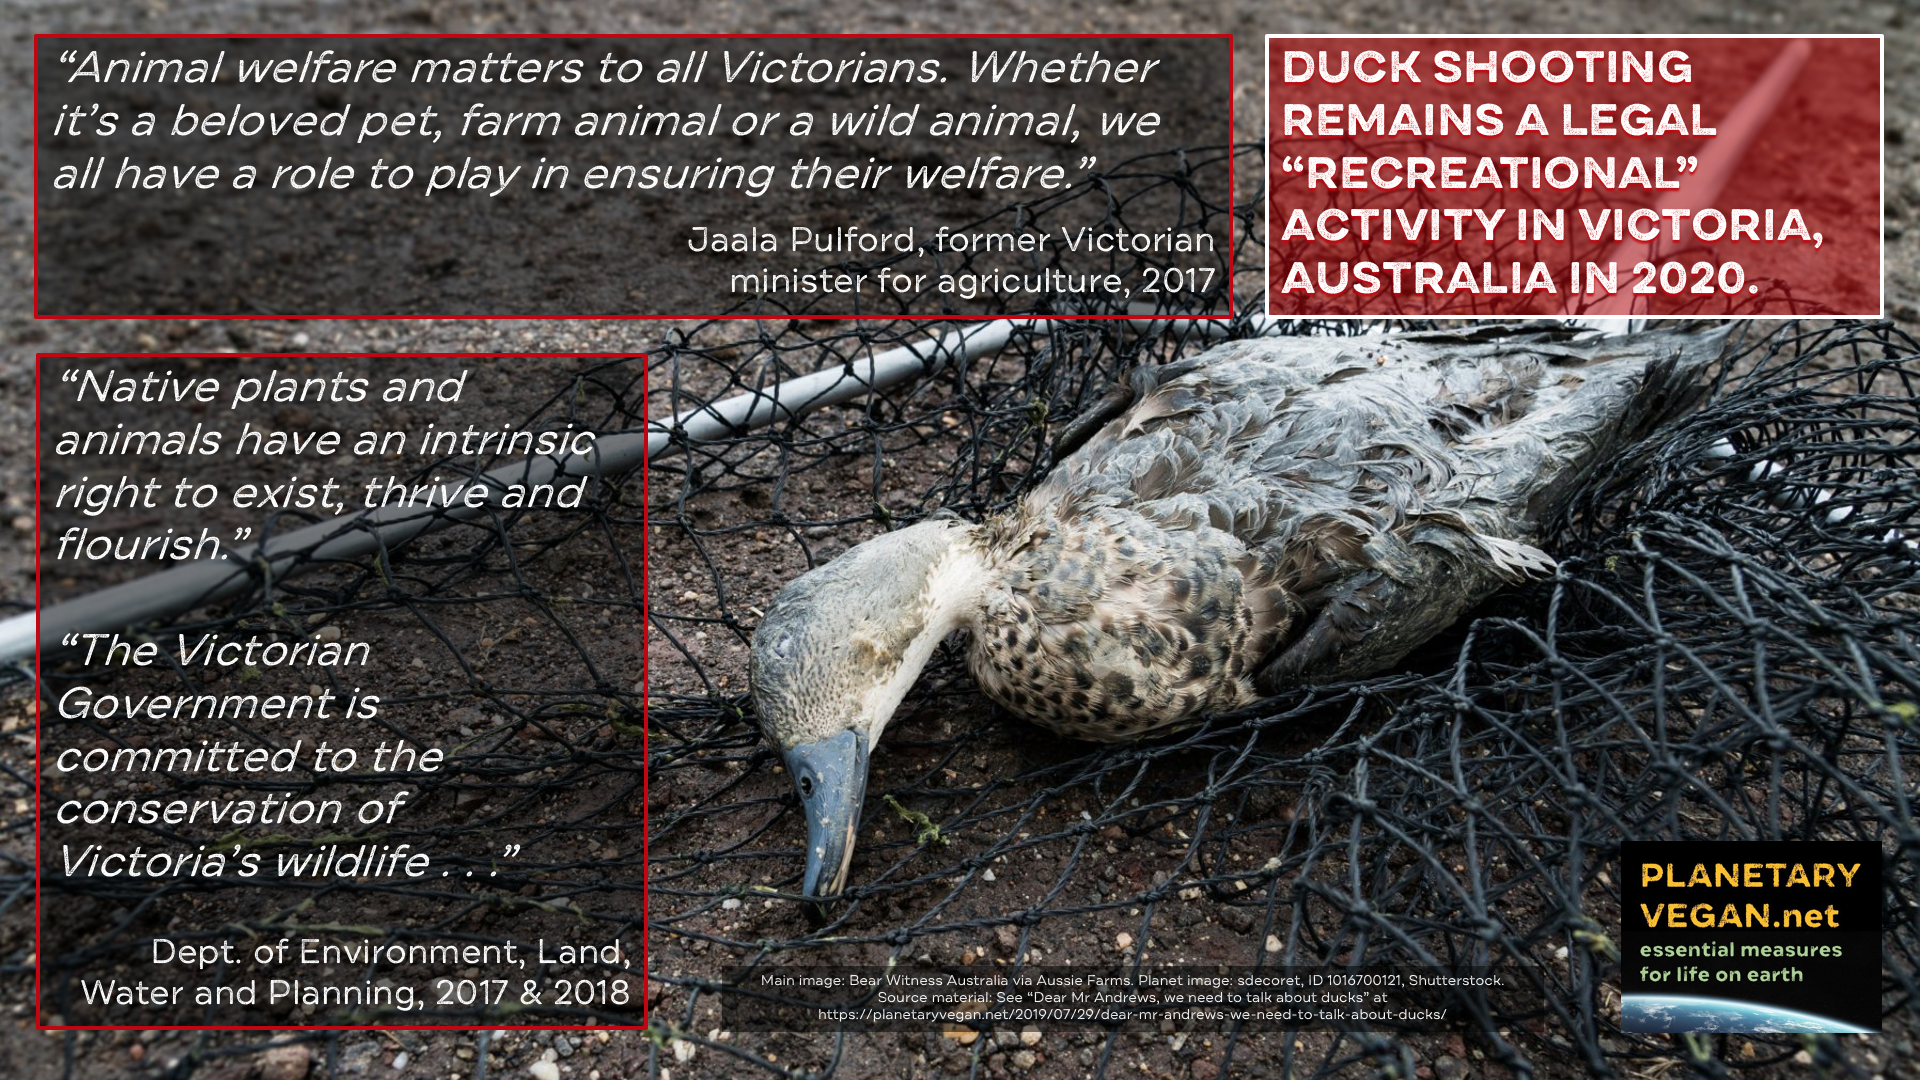
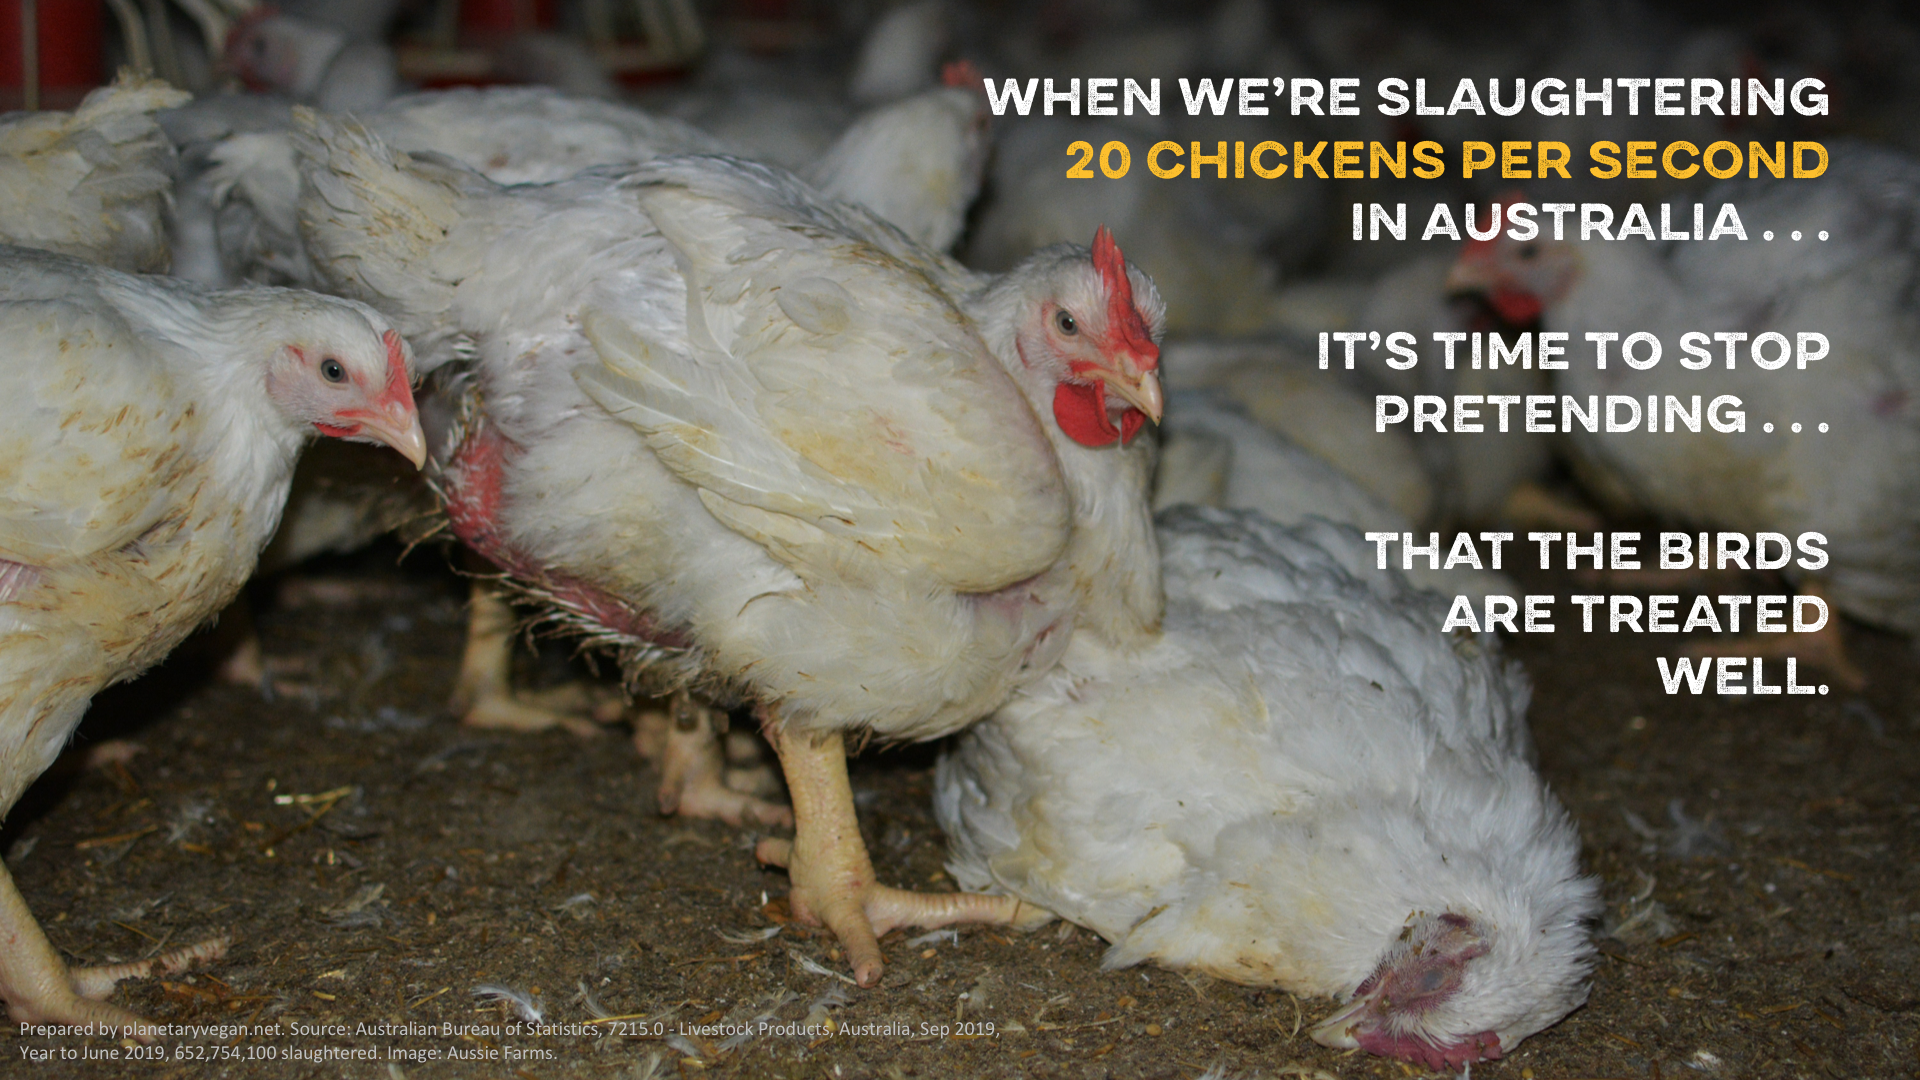
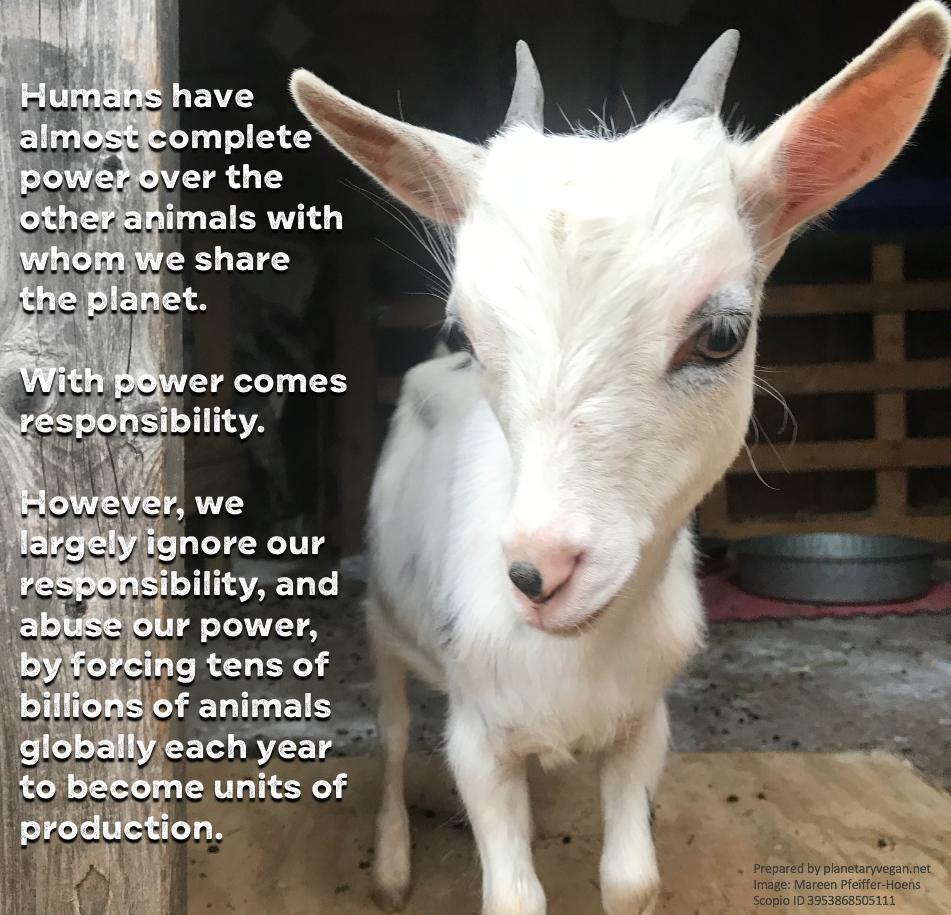
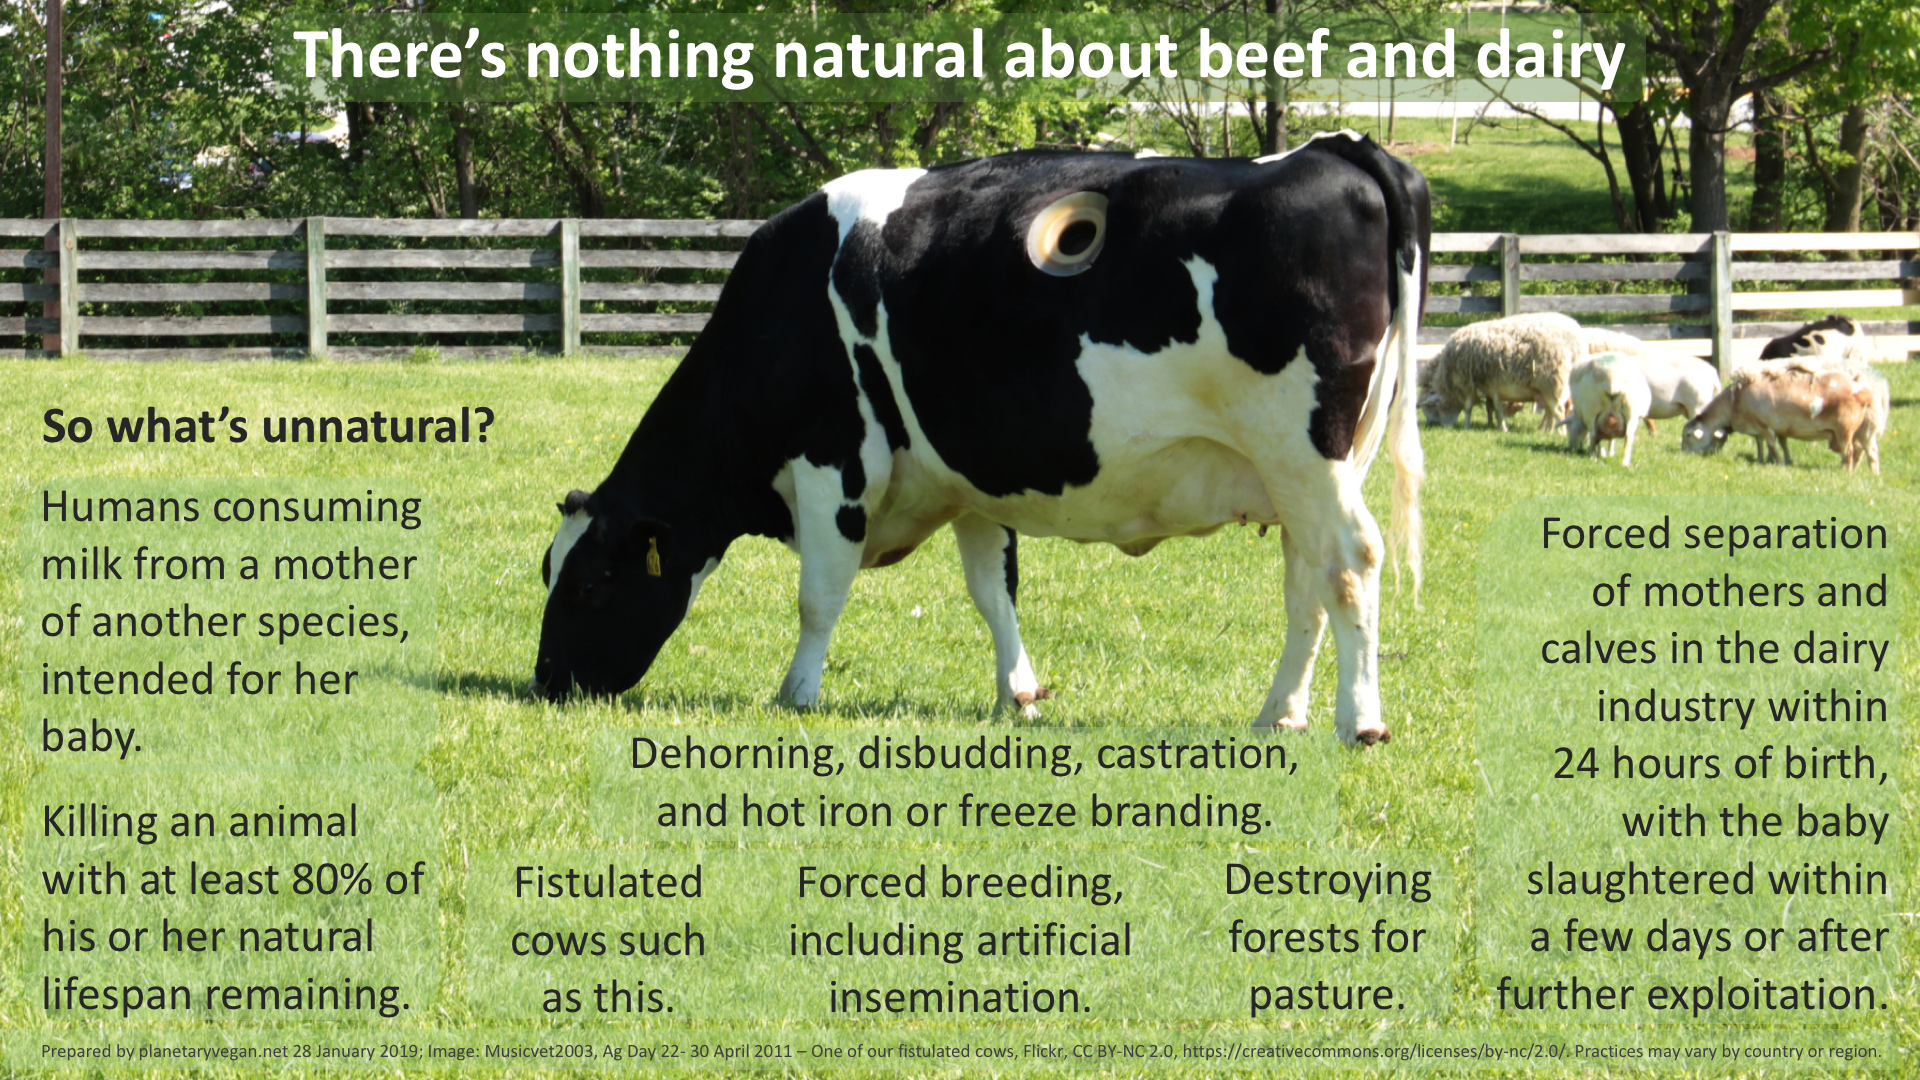
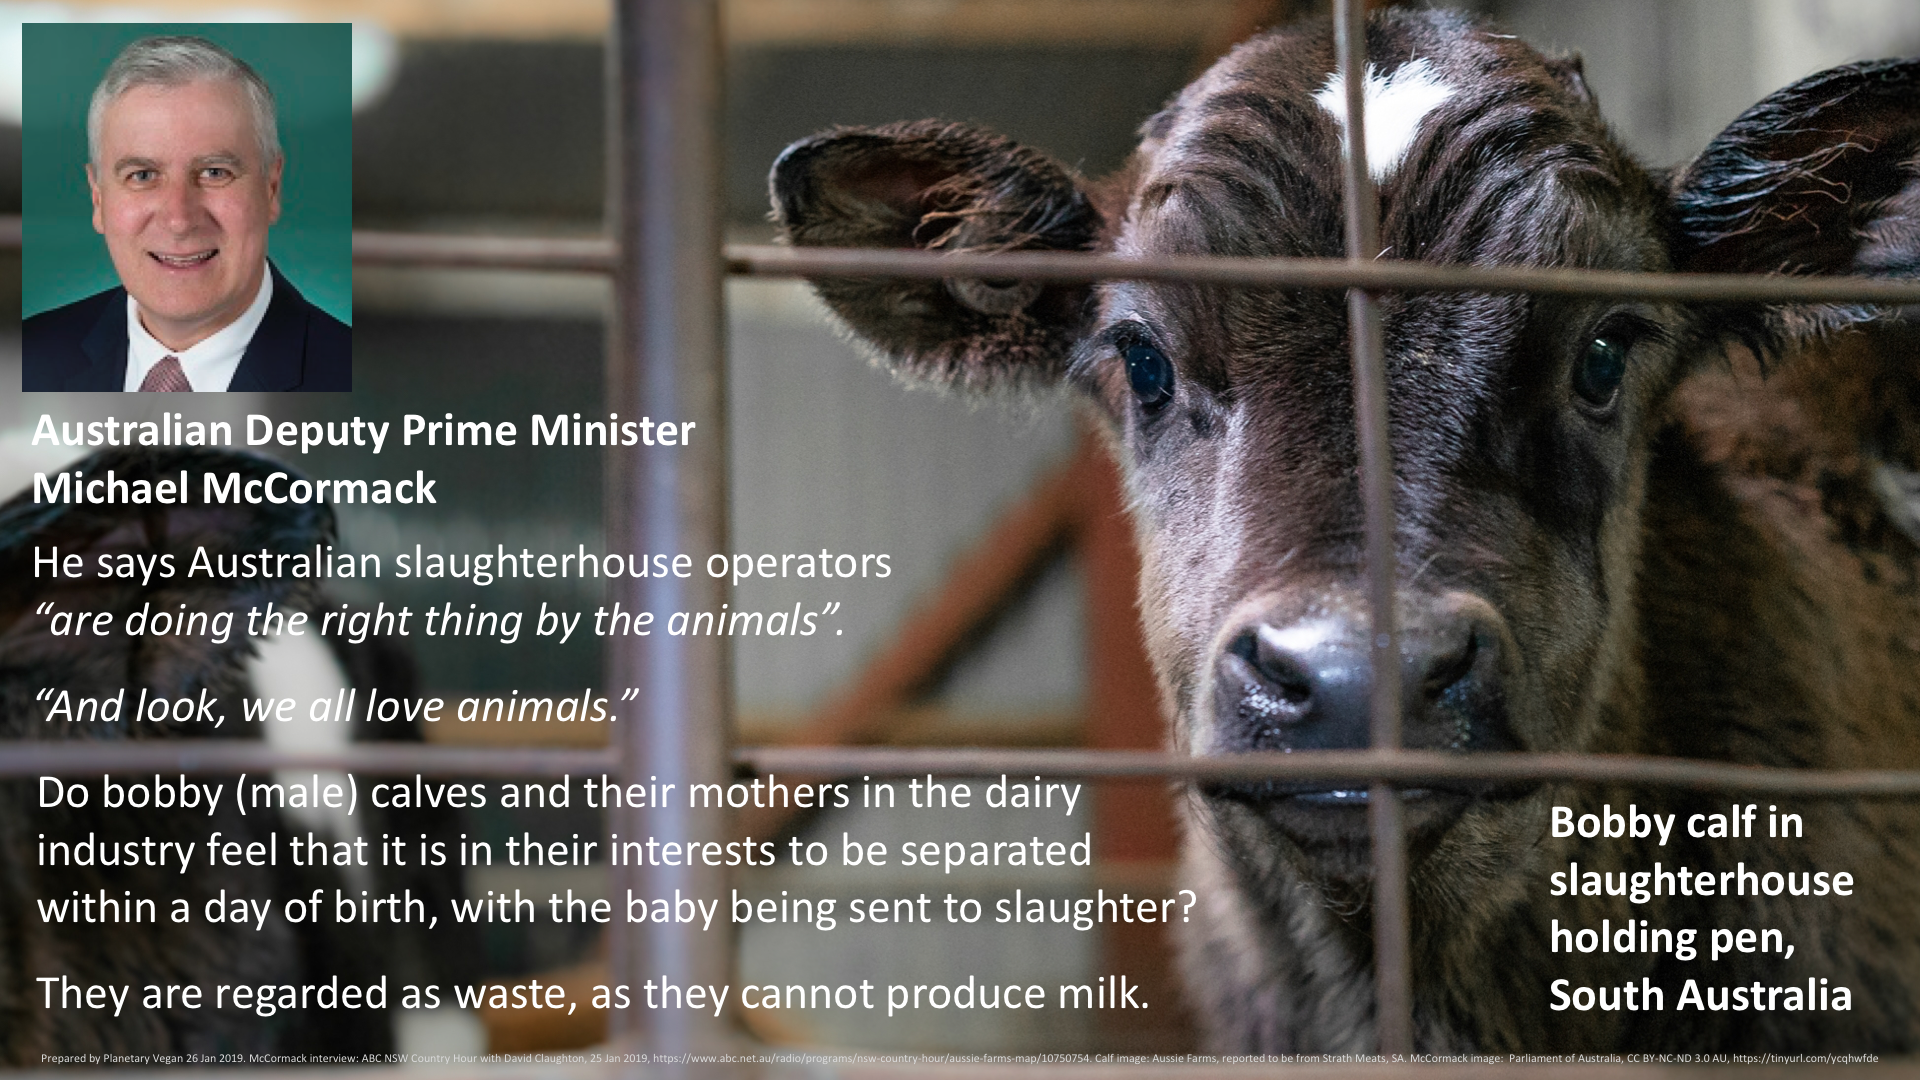
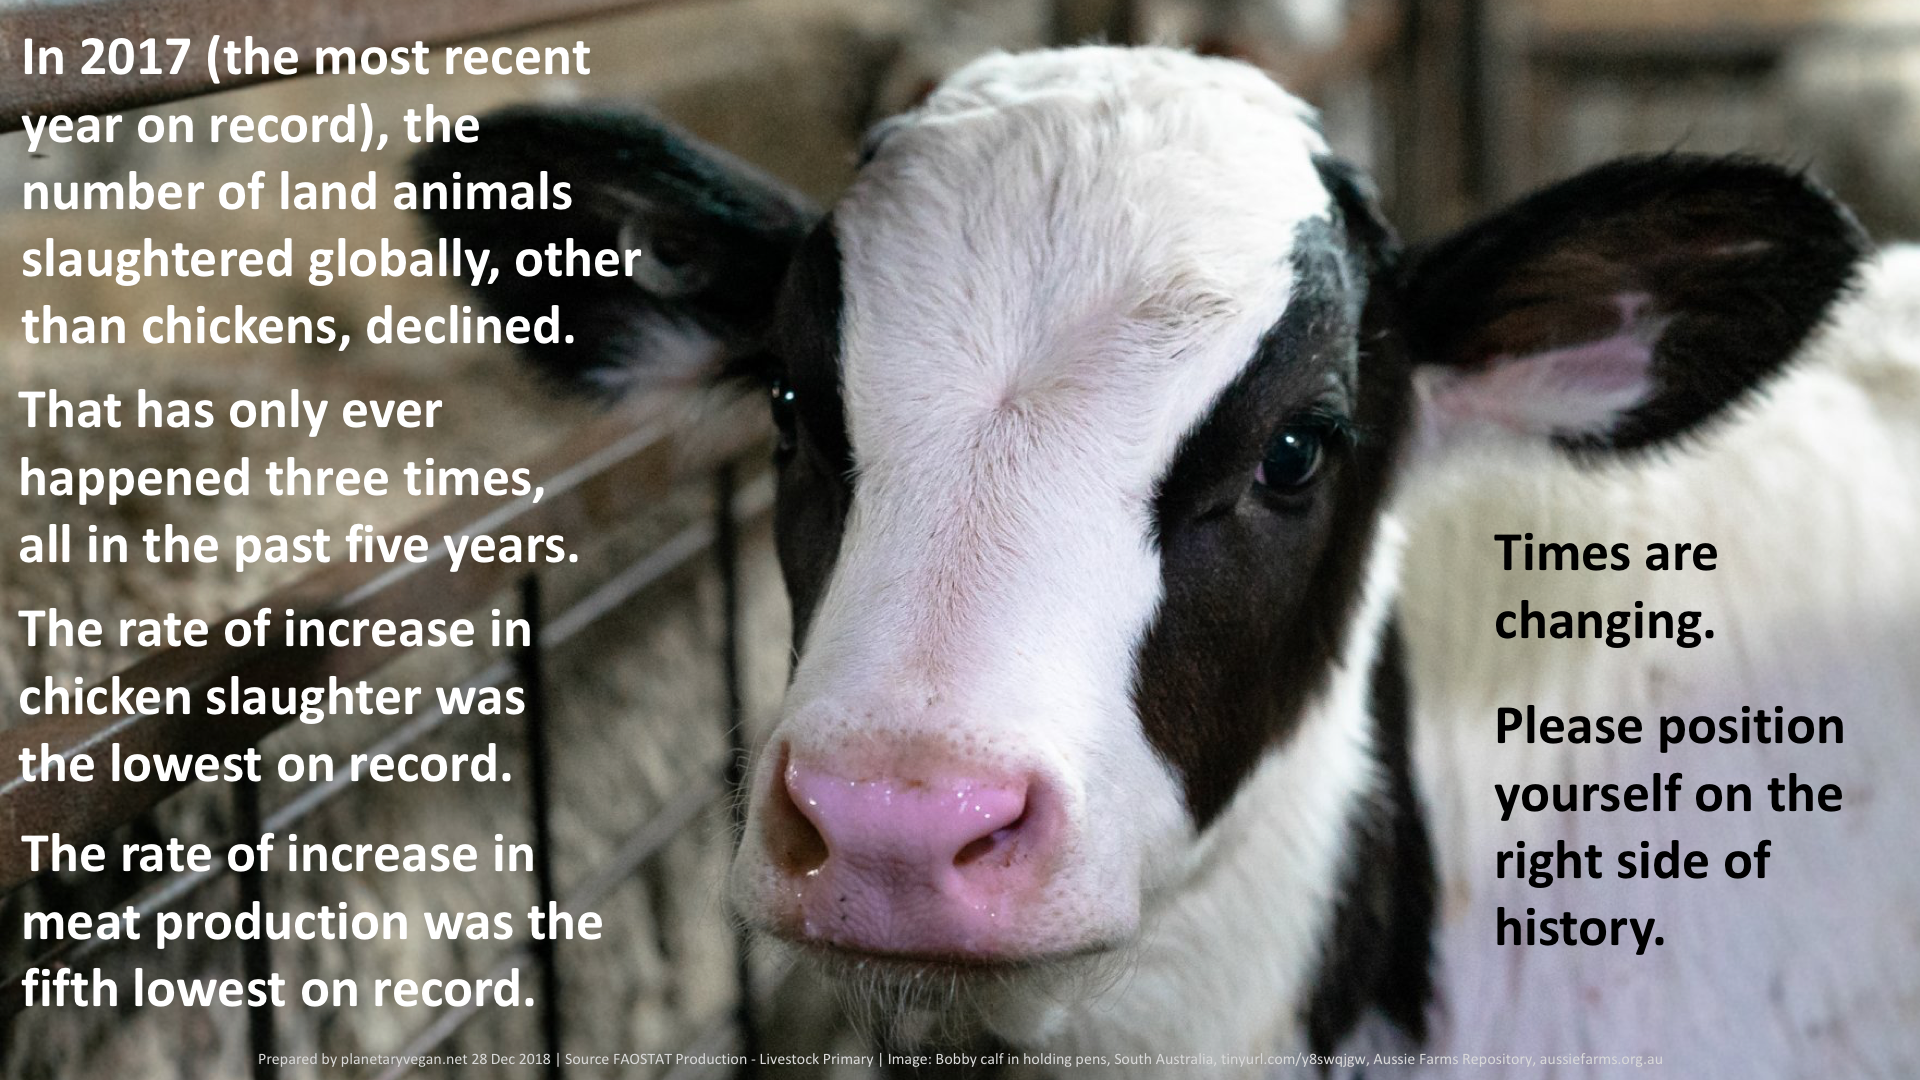
ANIMAL CRUELTY


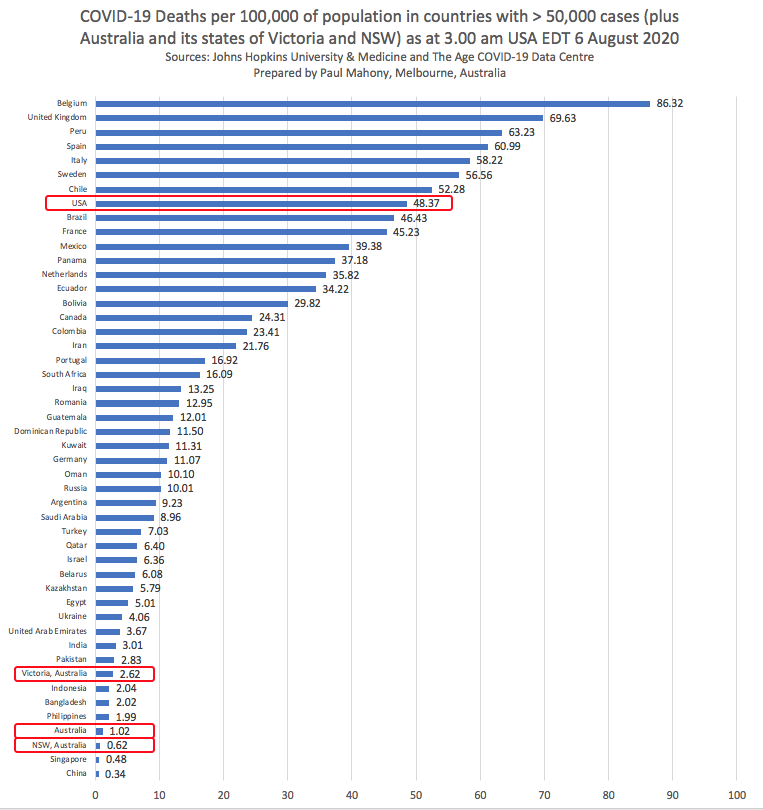
COVID-19

OUR PLANETARY MALAISE
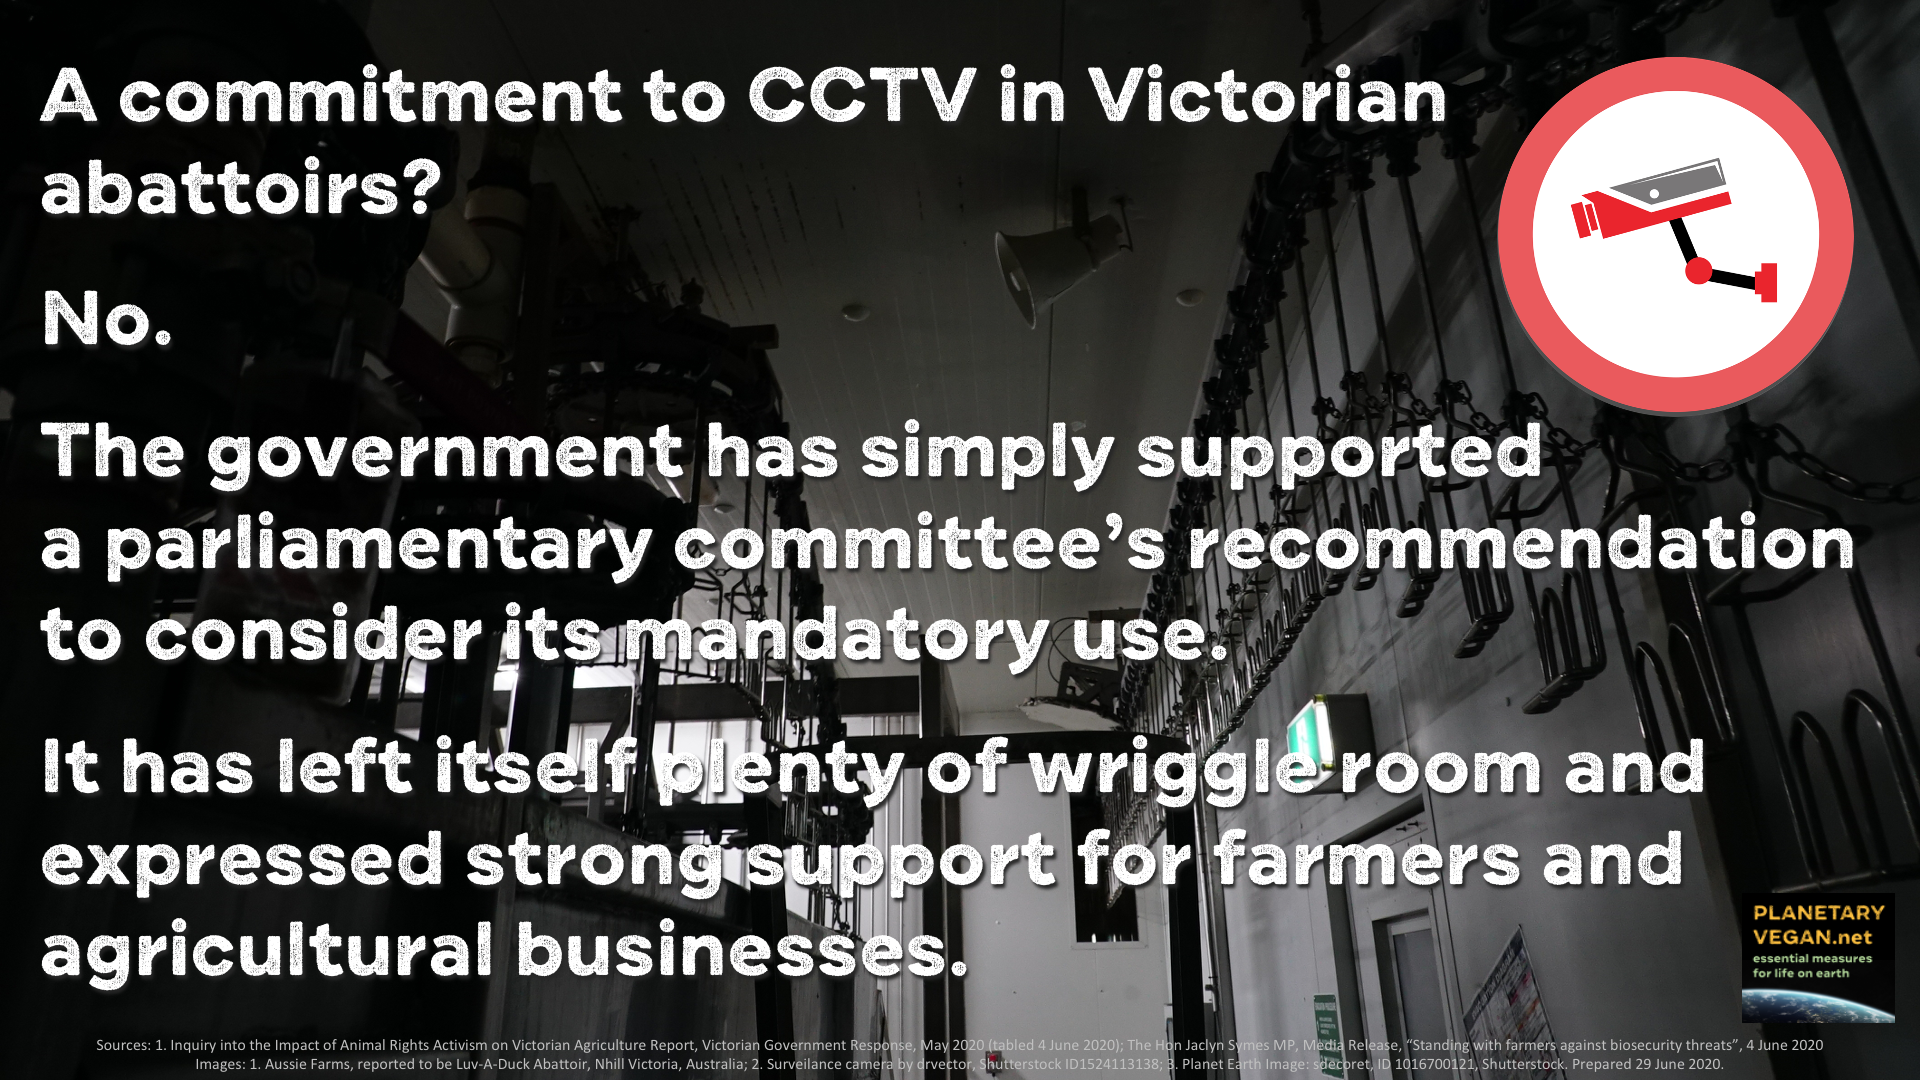
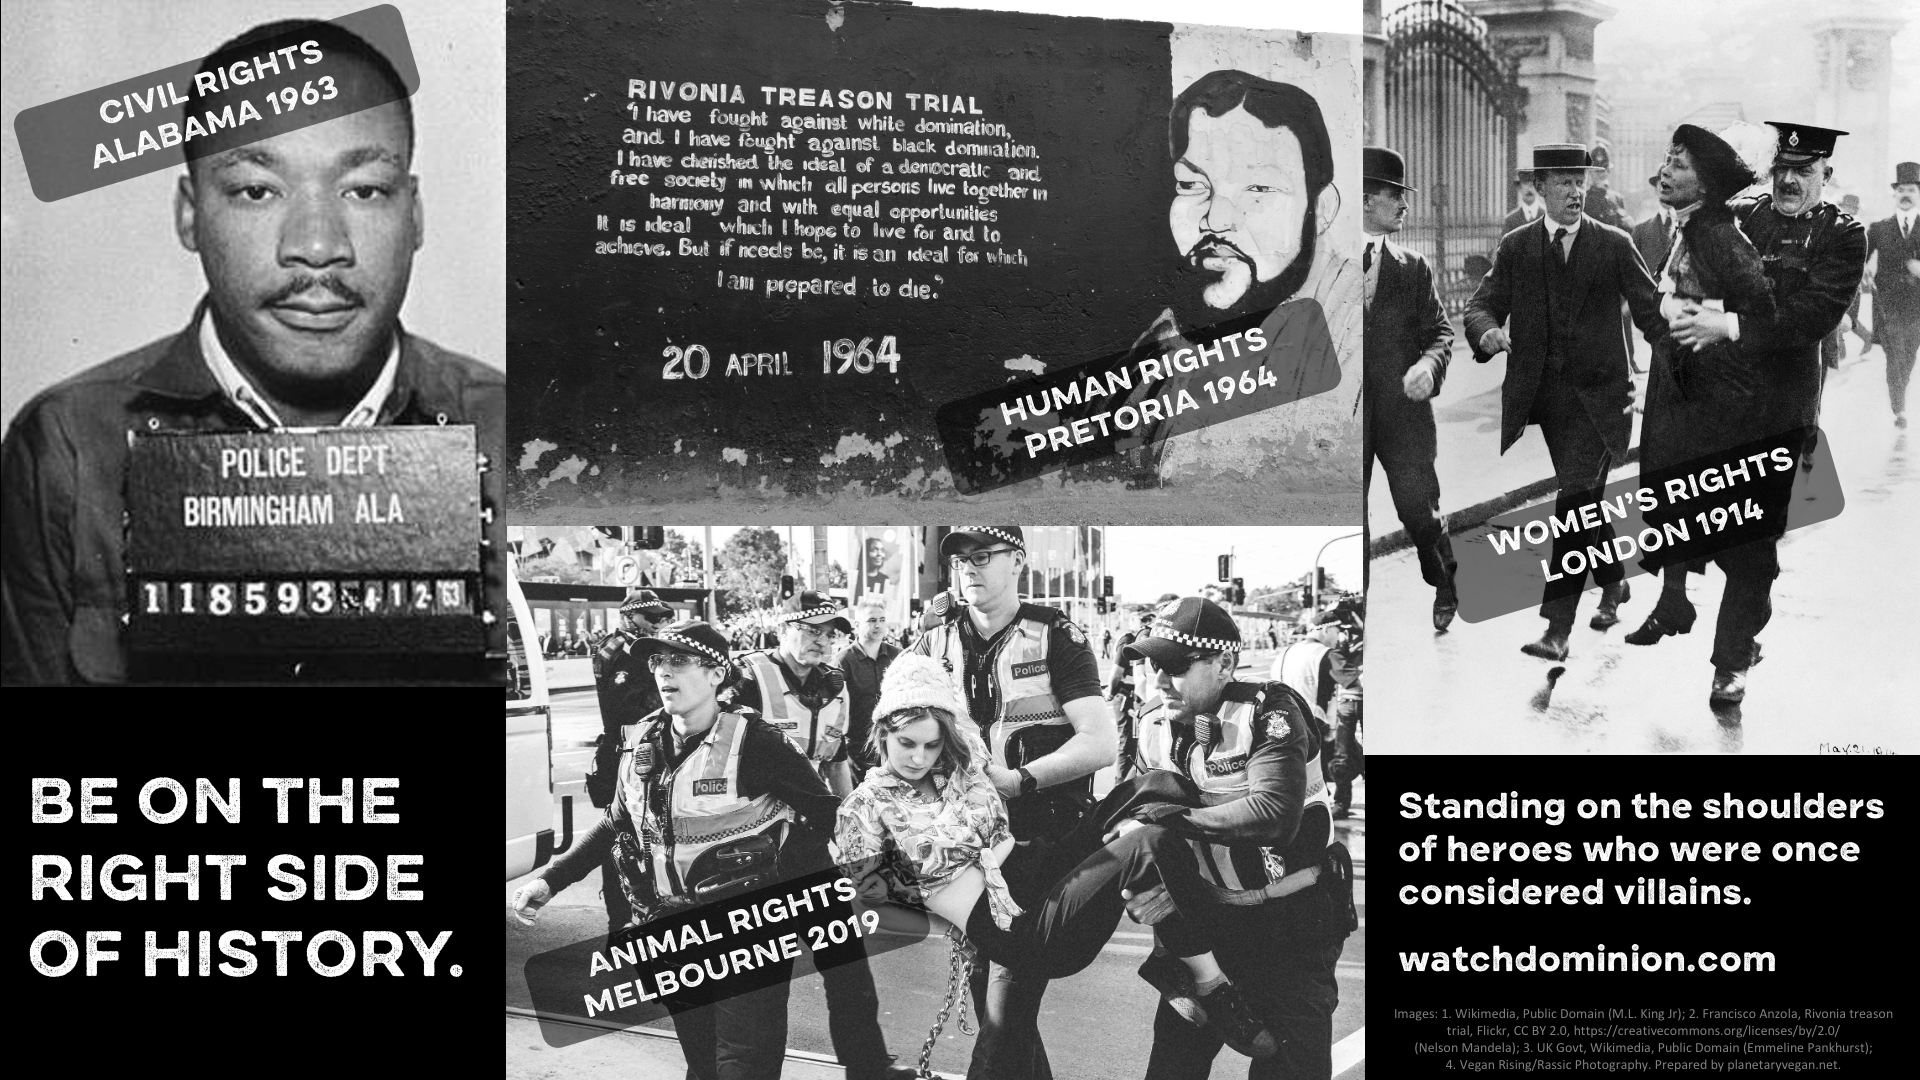
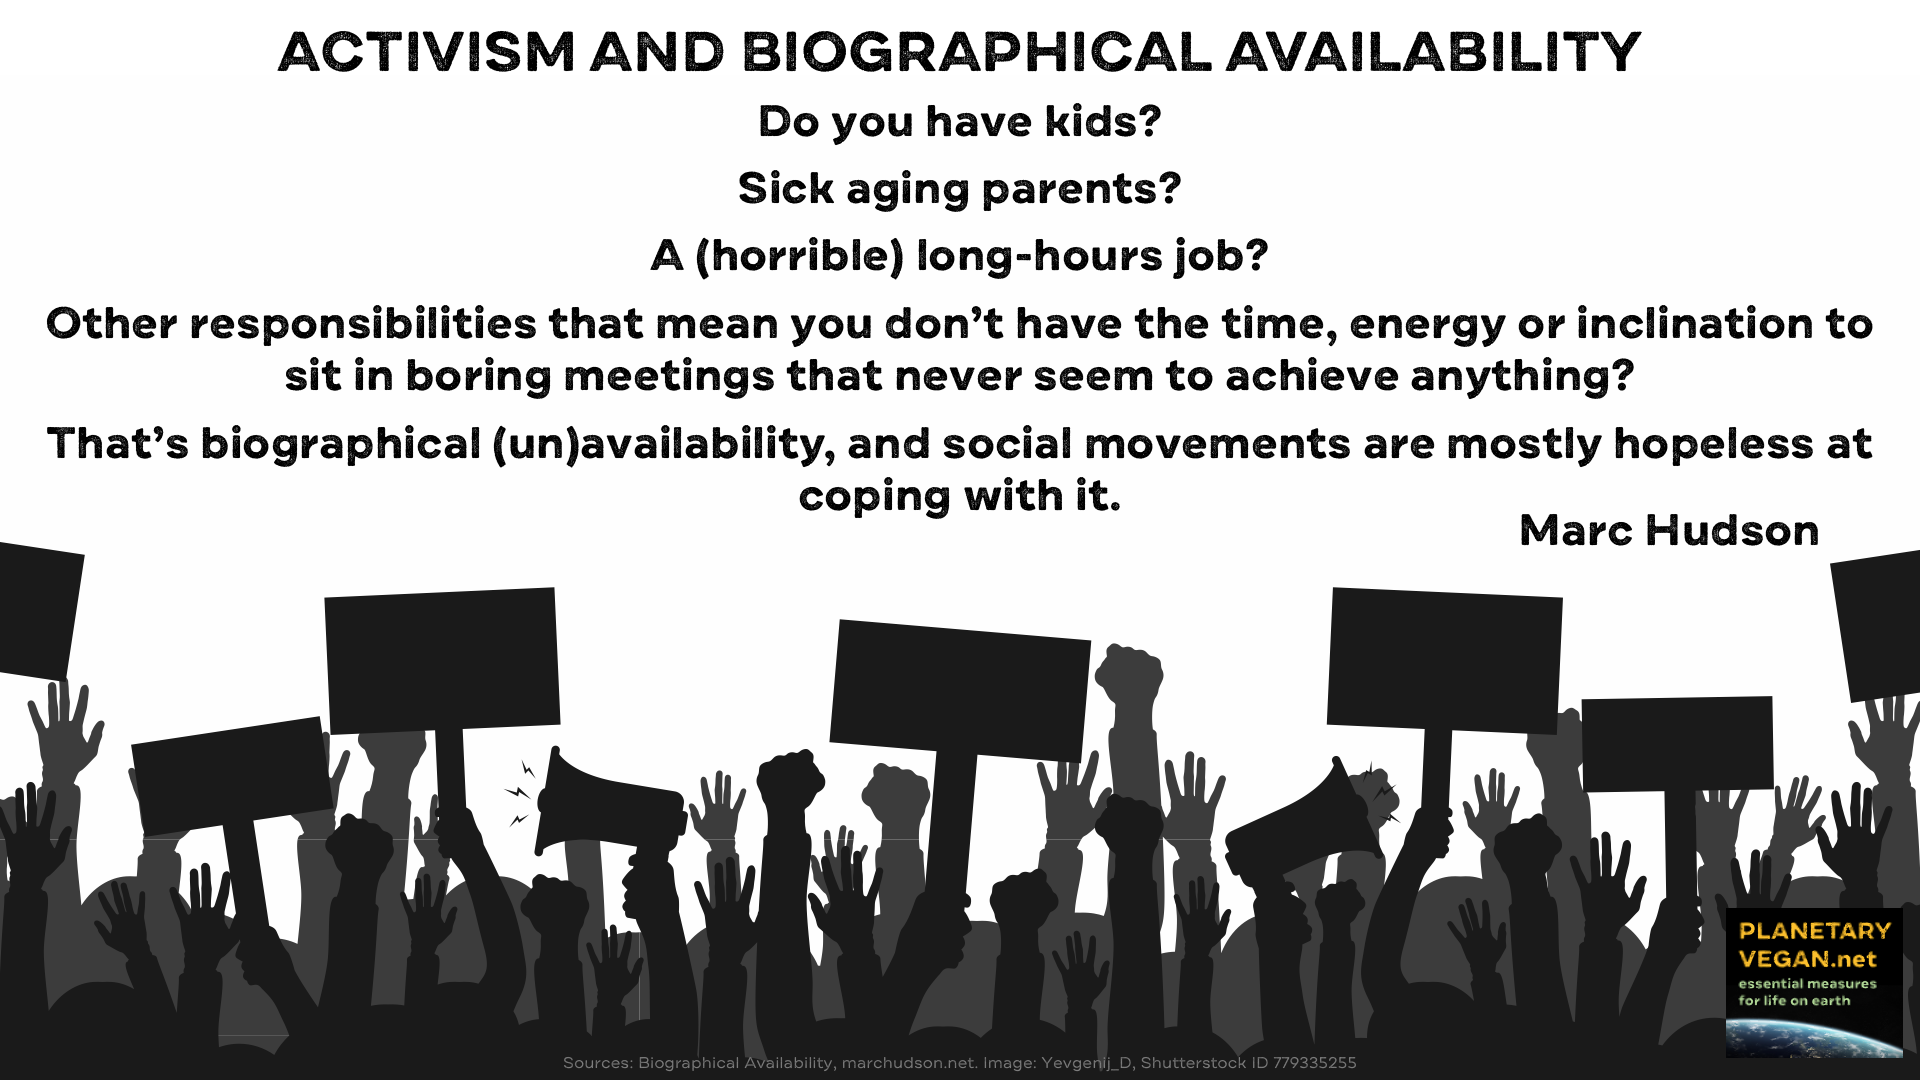
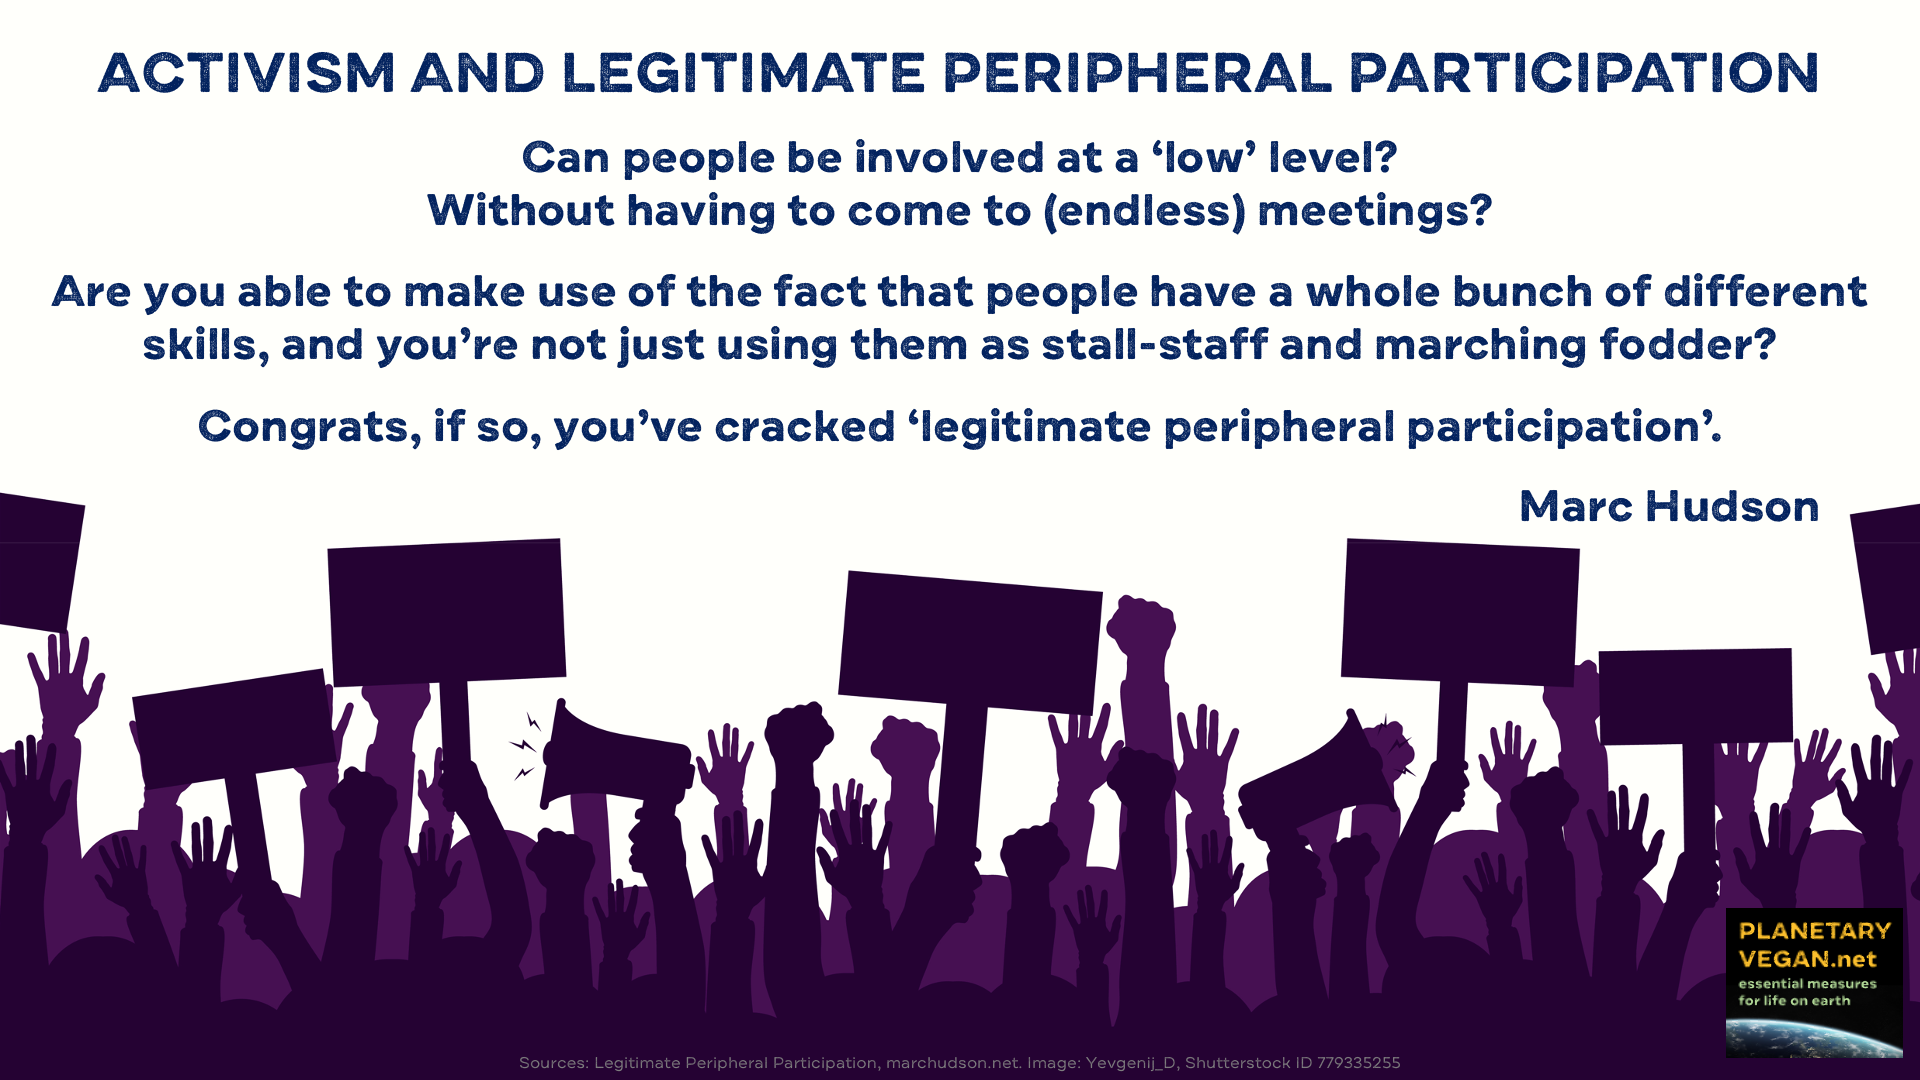
ACTIVISM

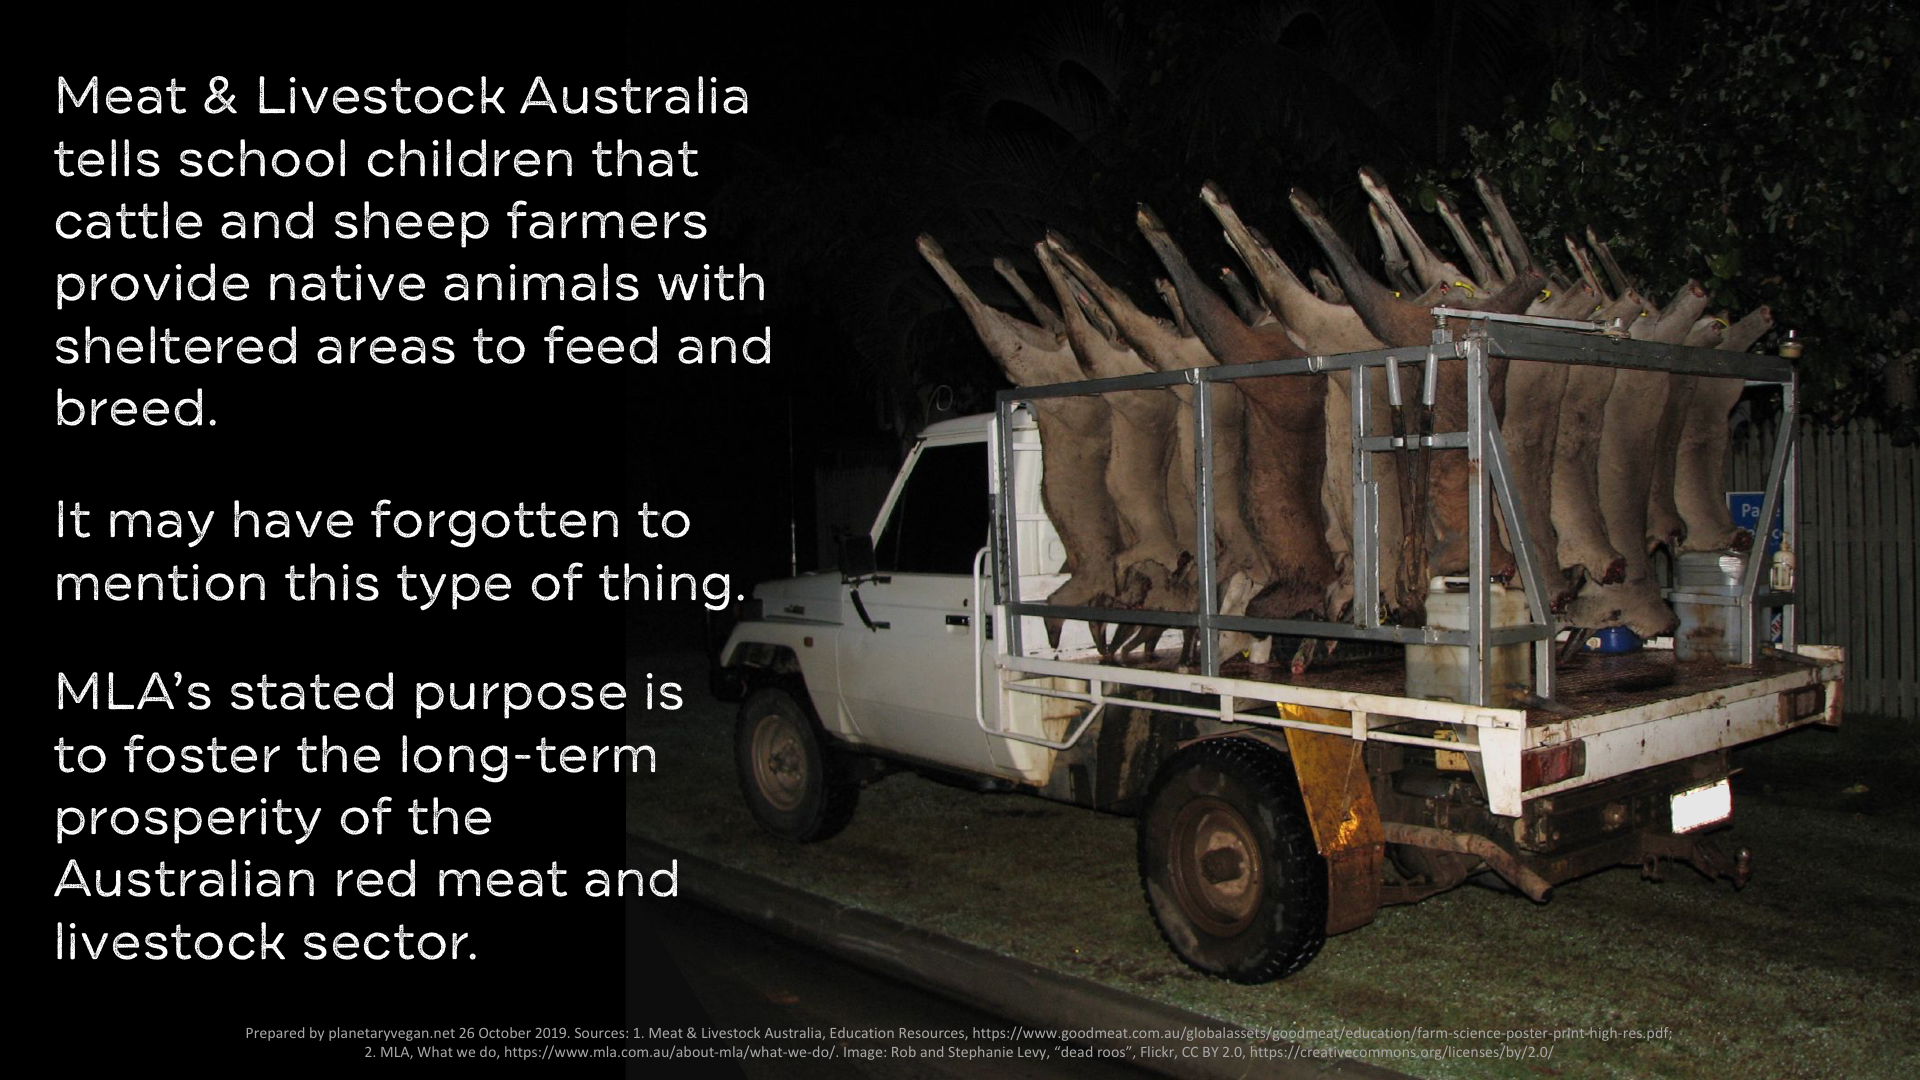
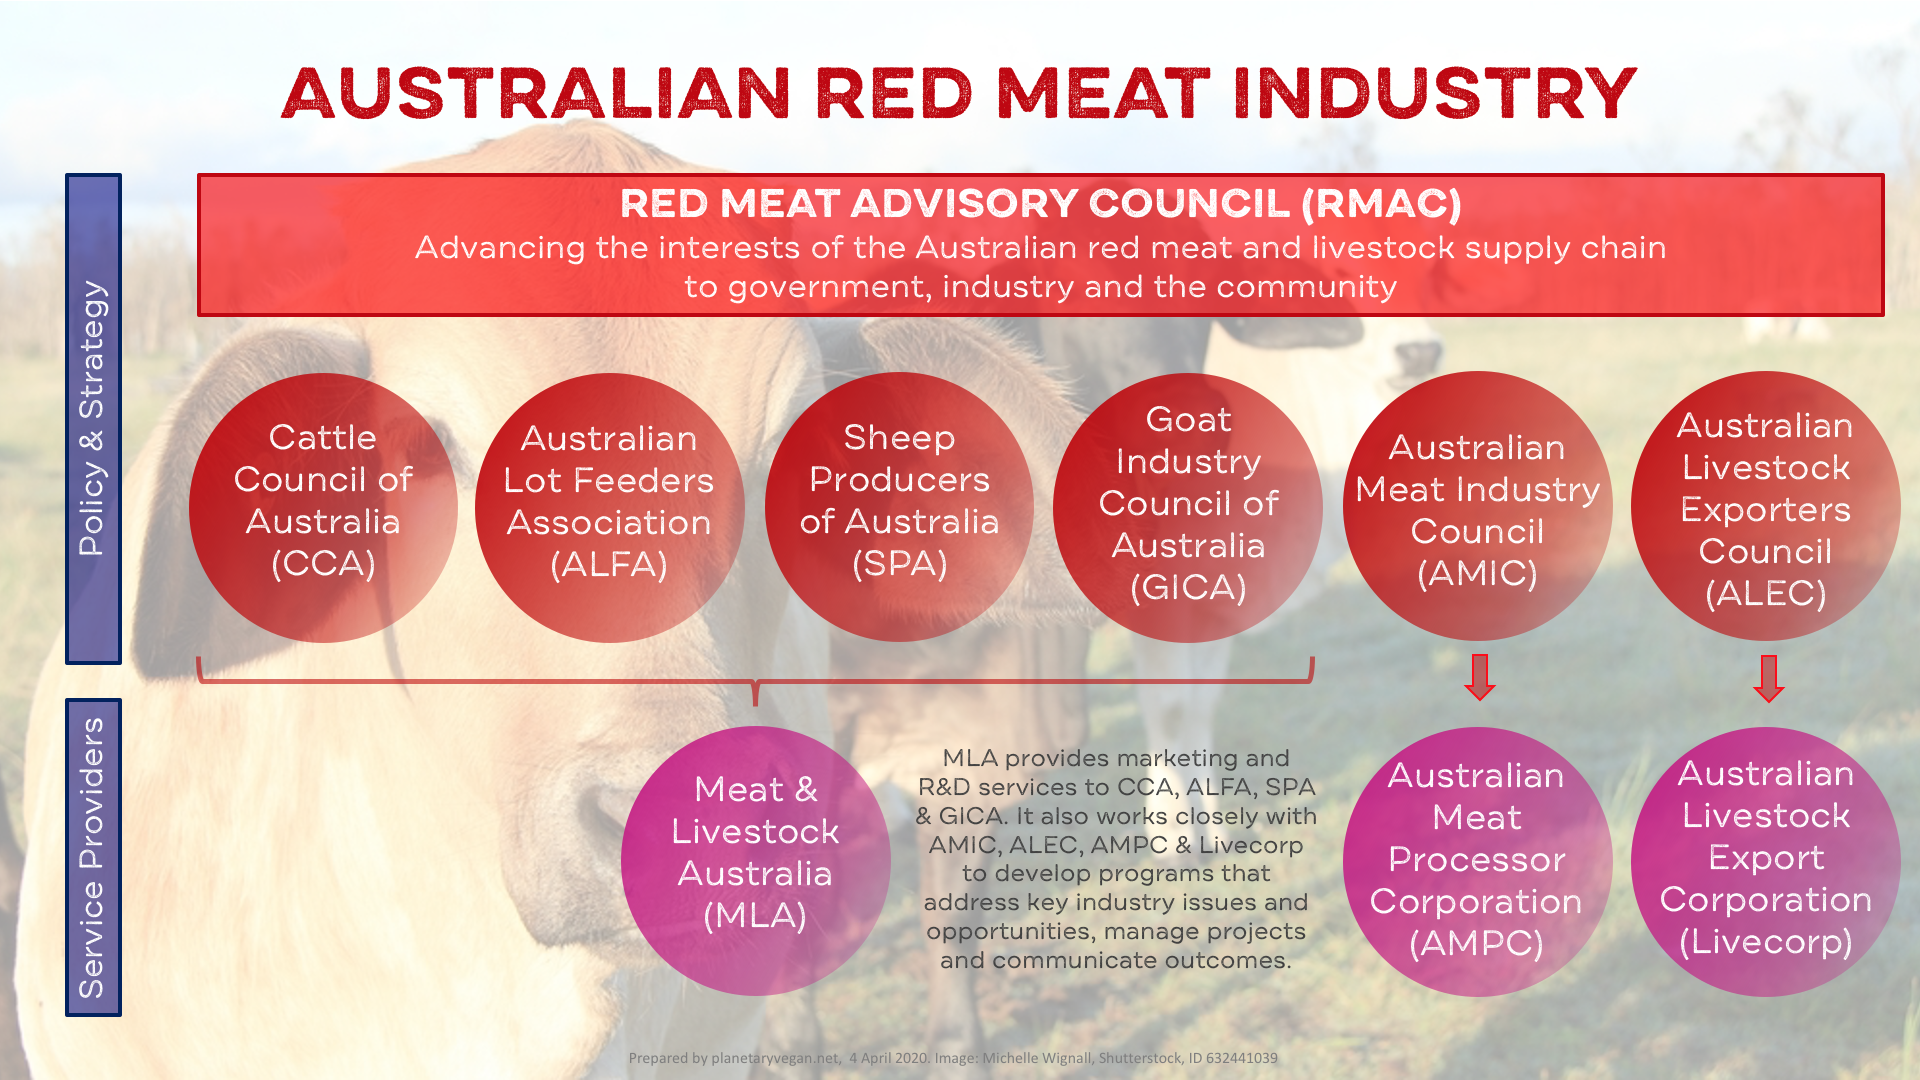
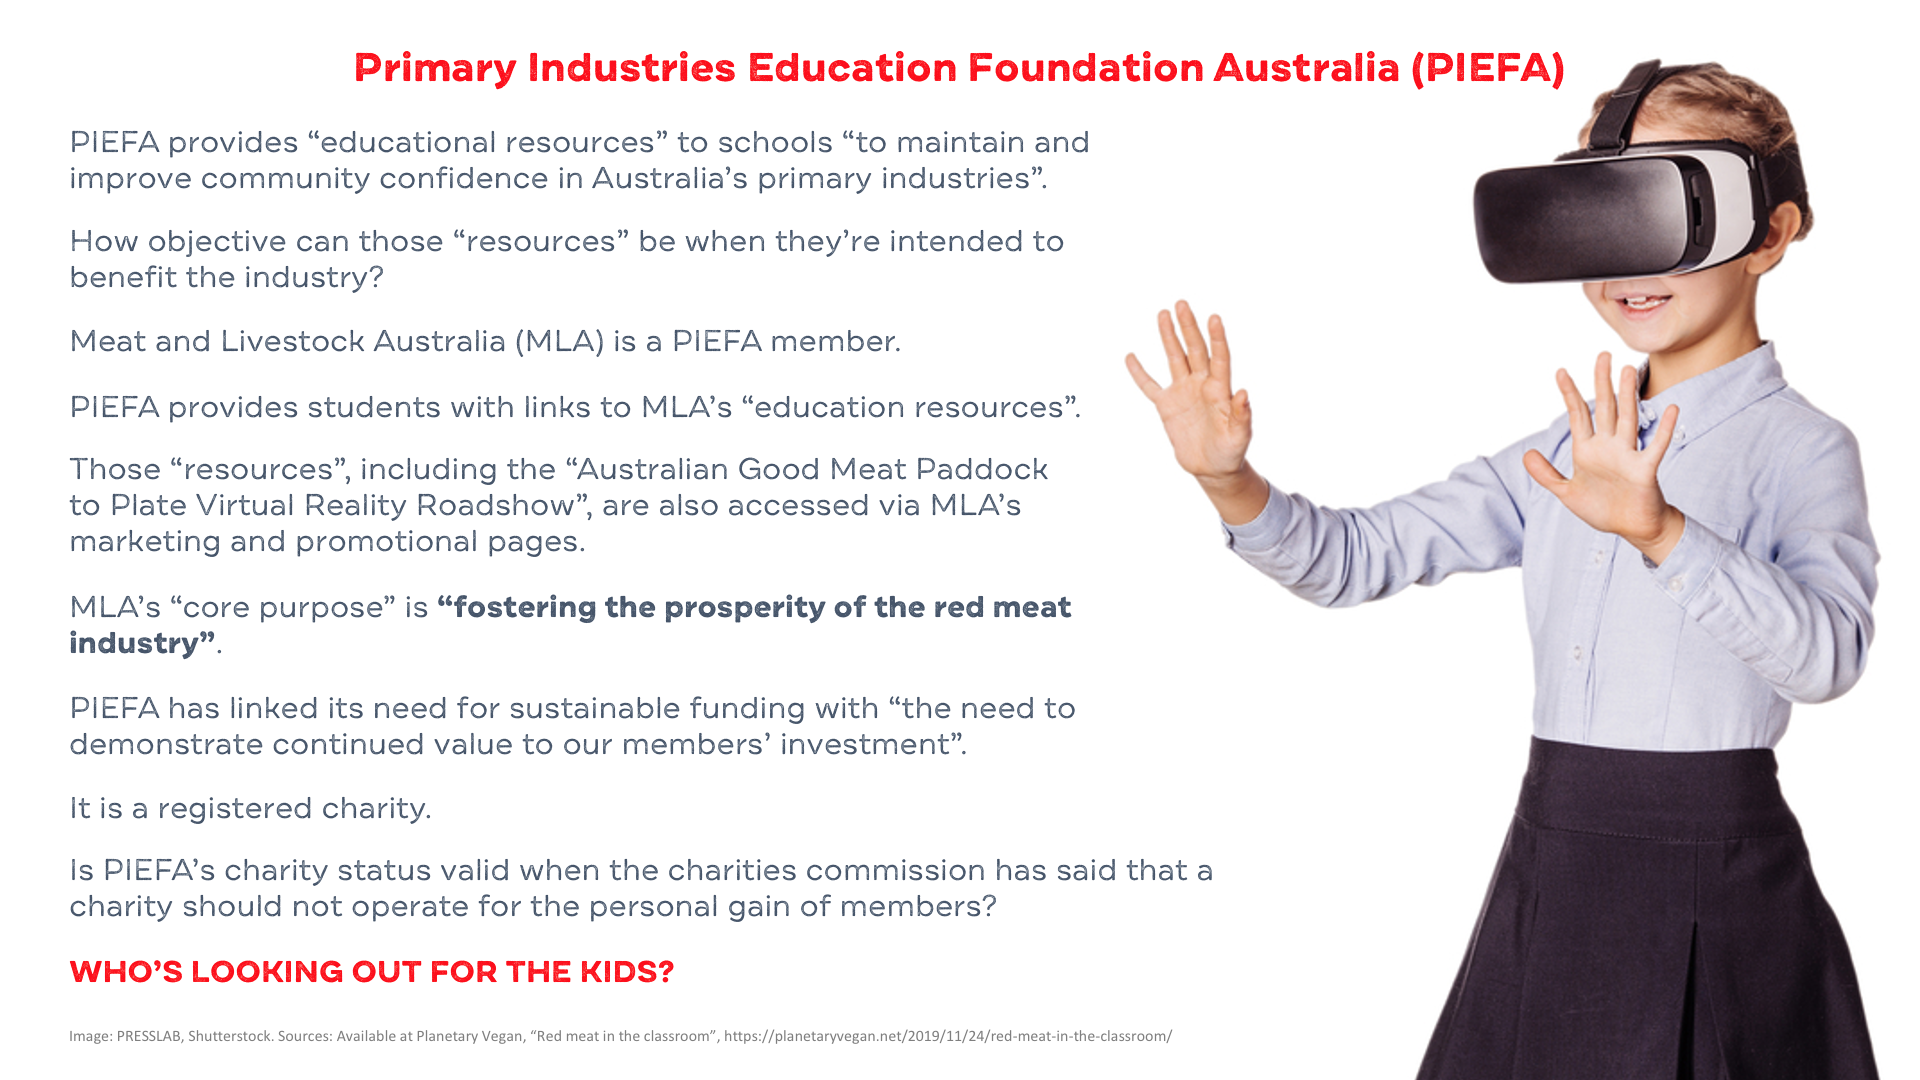
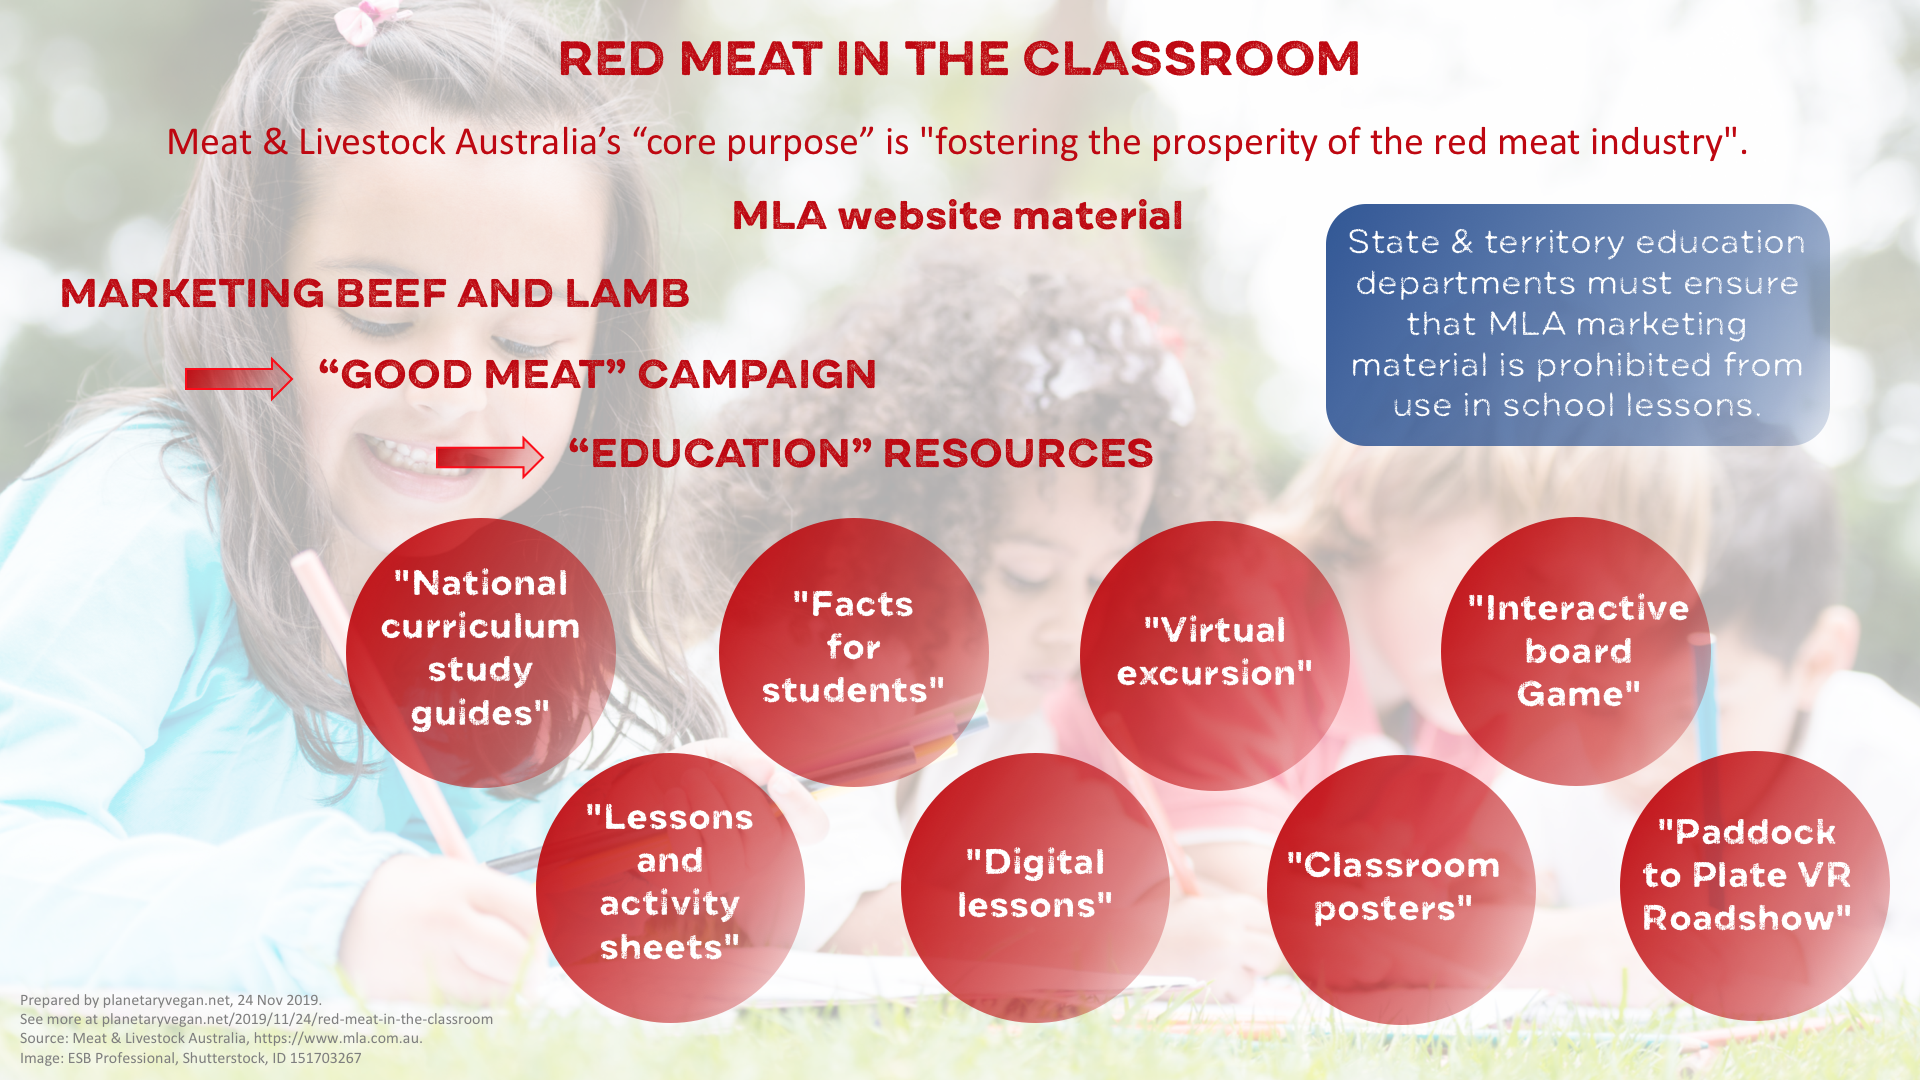
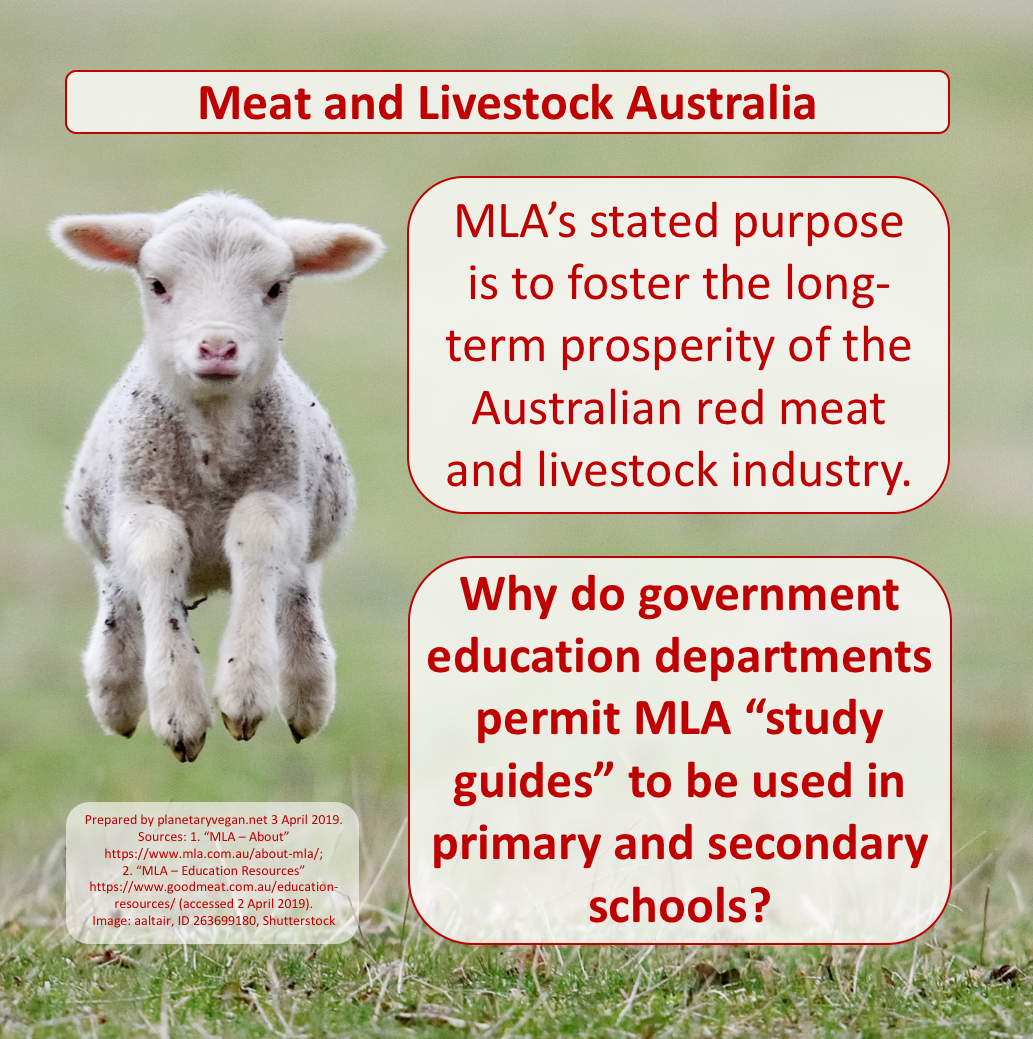
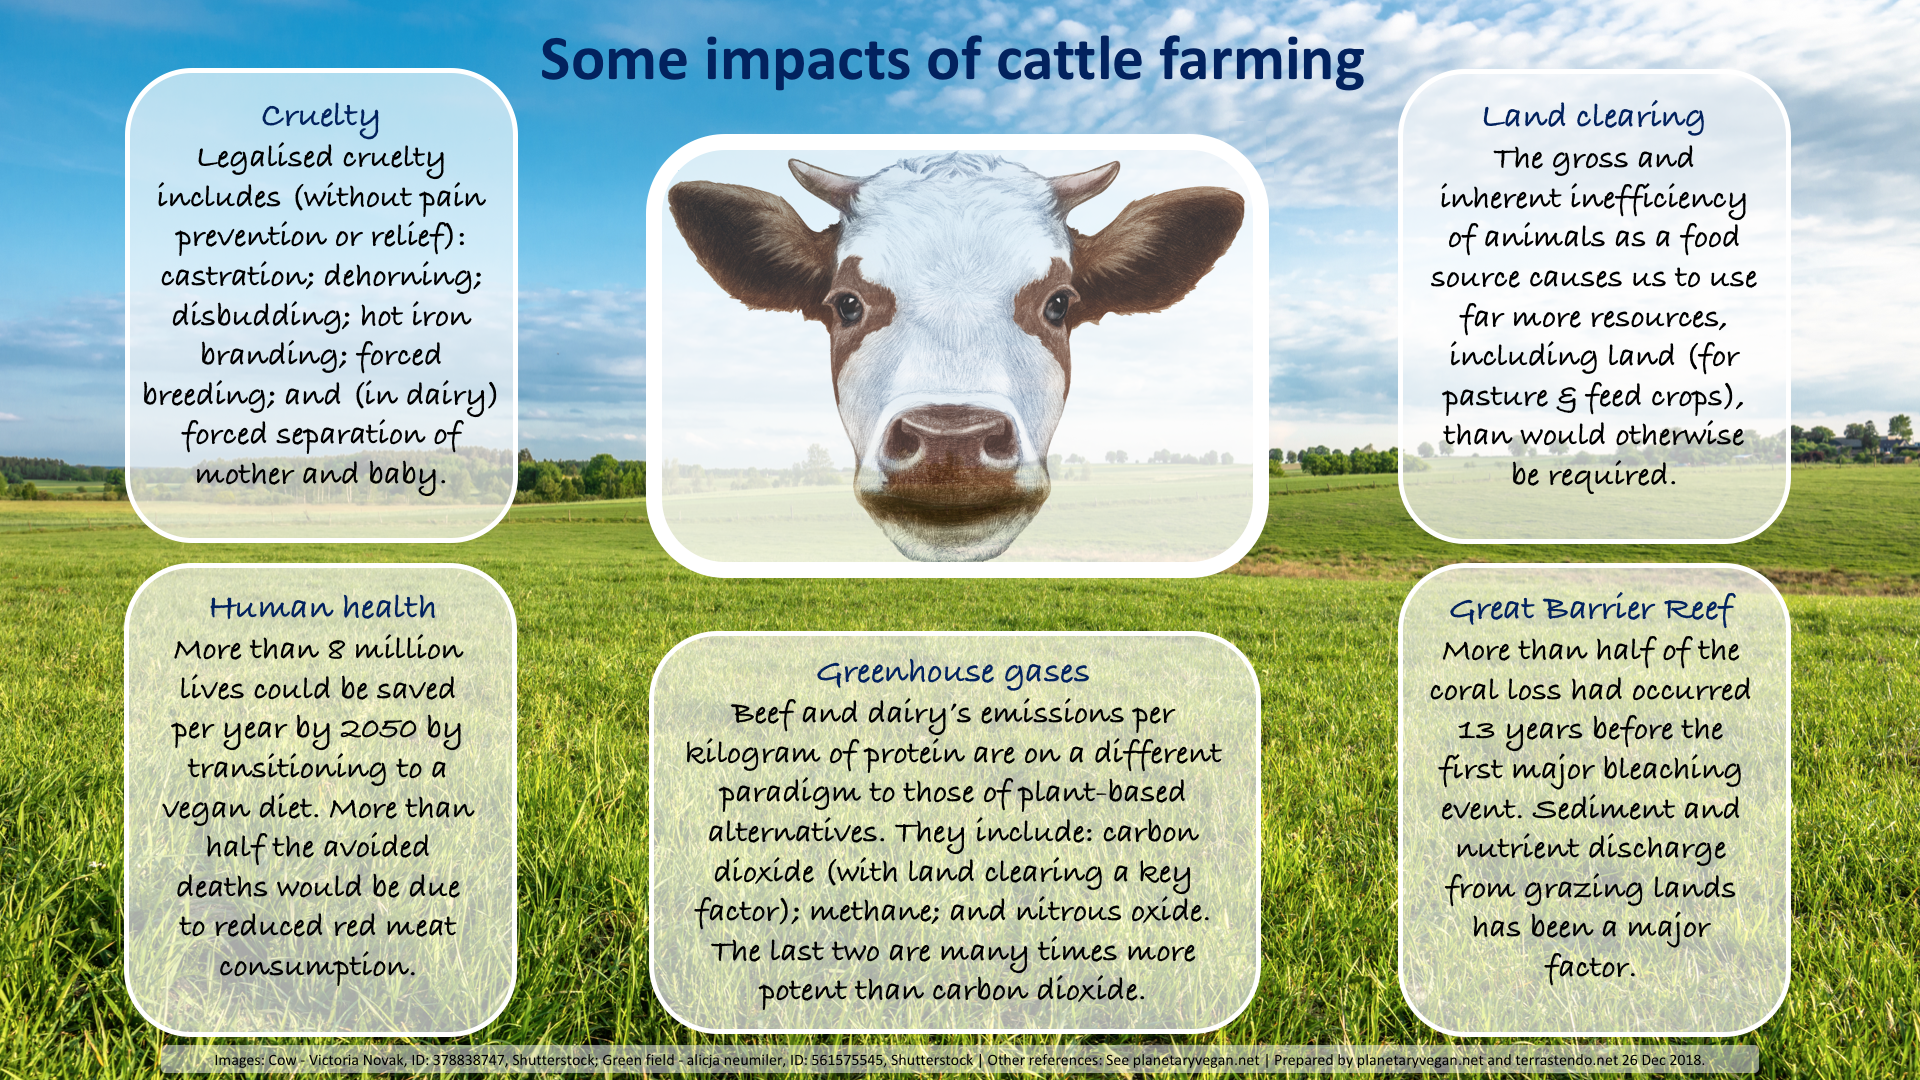
THE AUSTRALIAN RED MEAT INDUSTRY

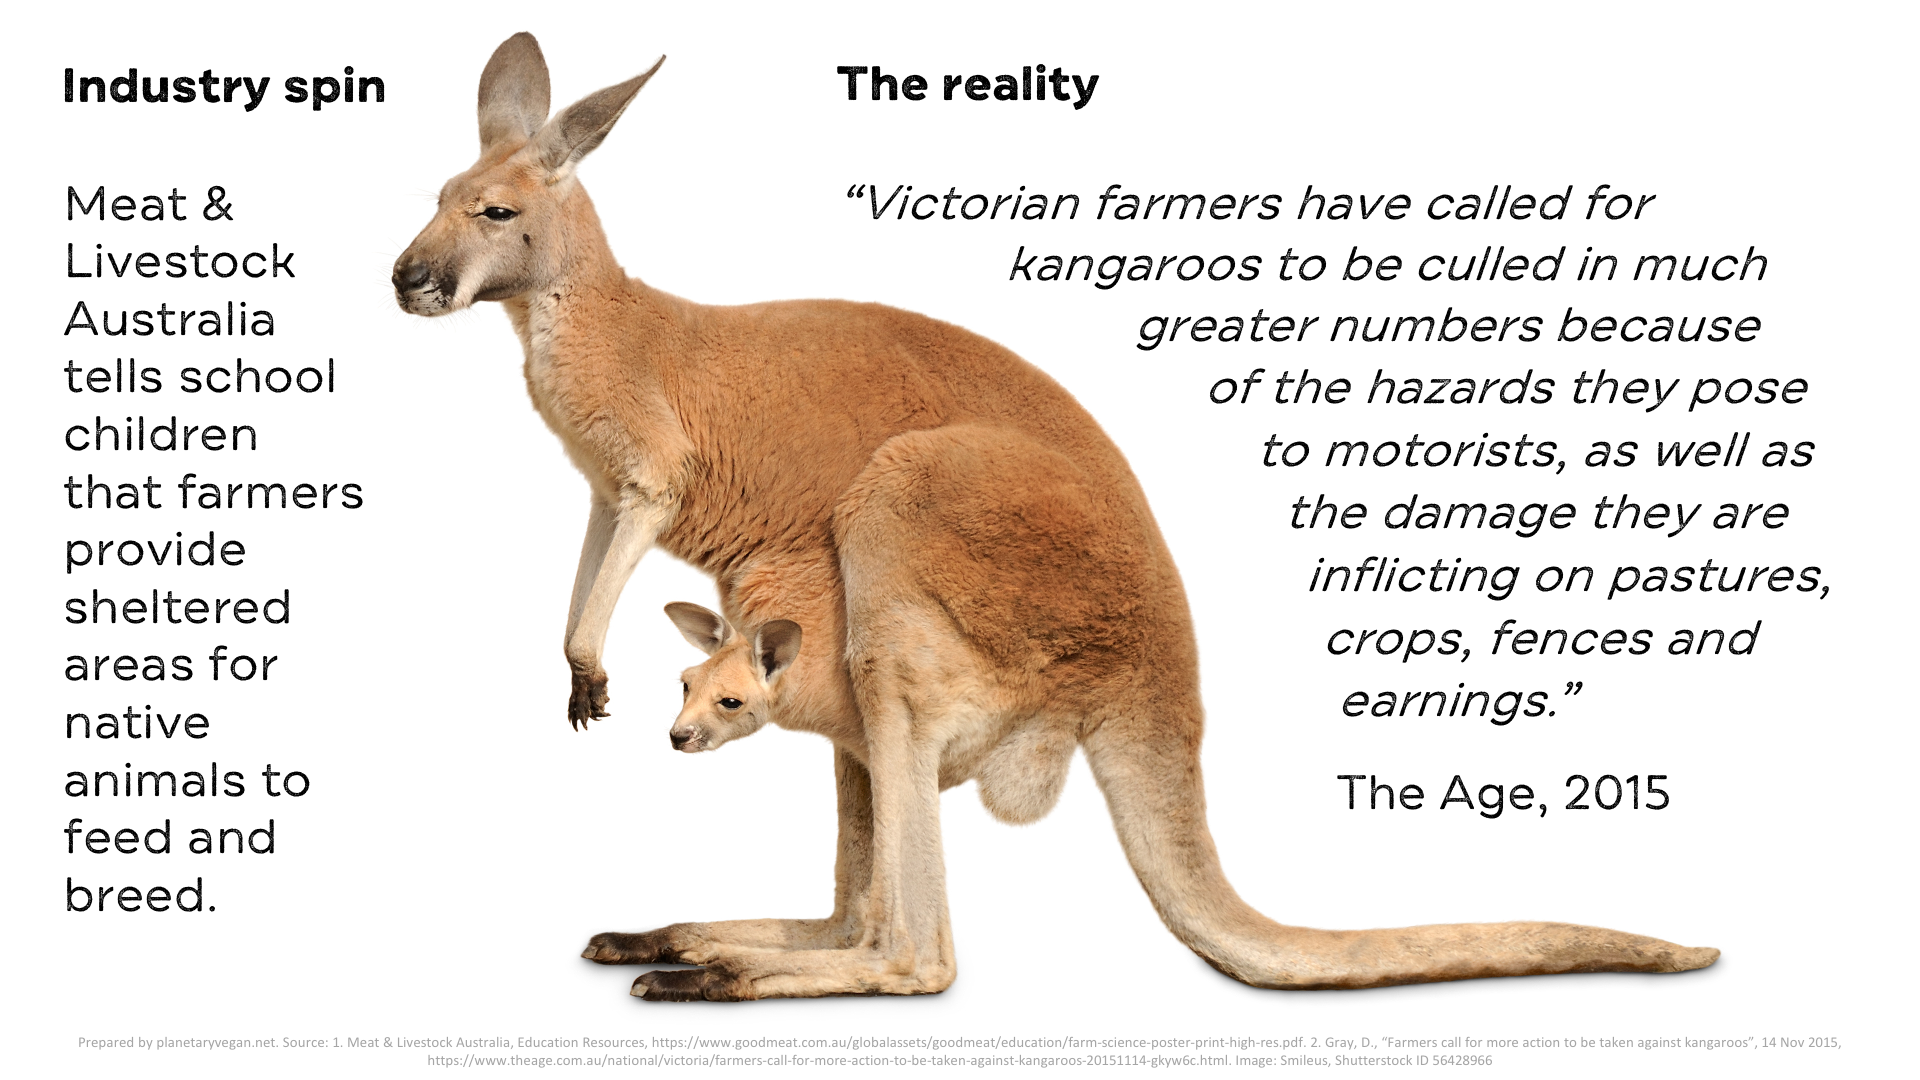
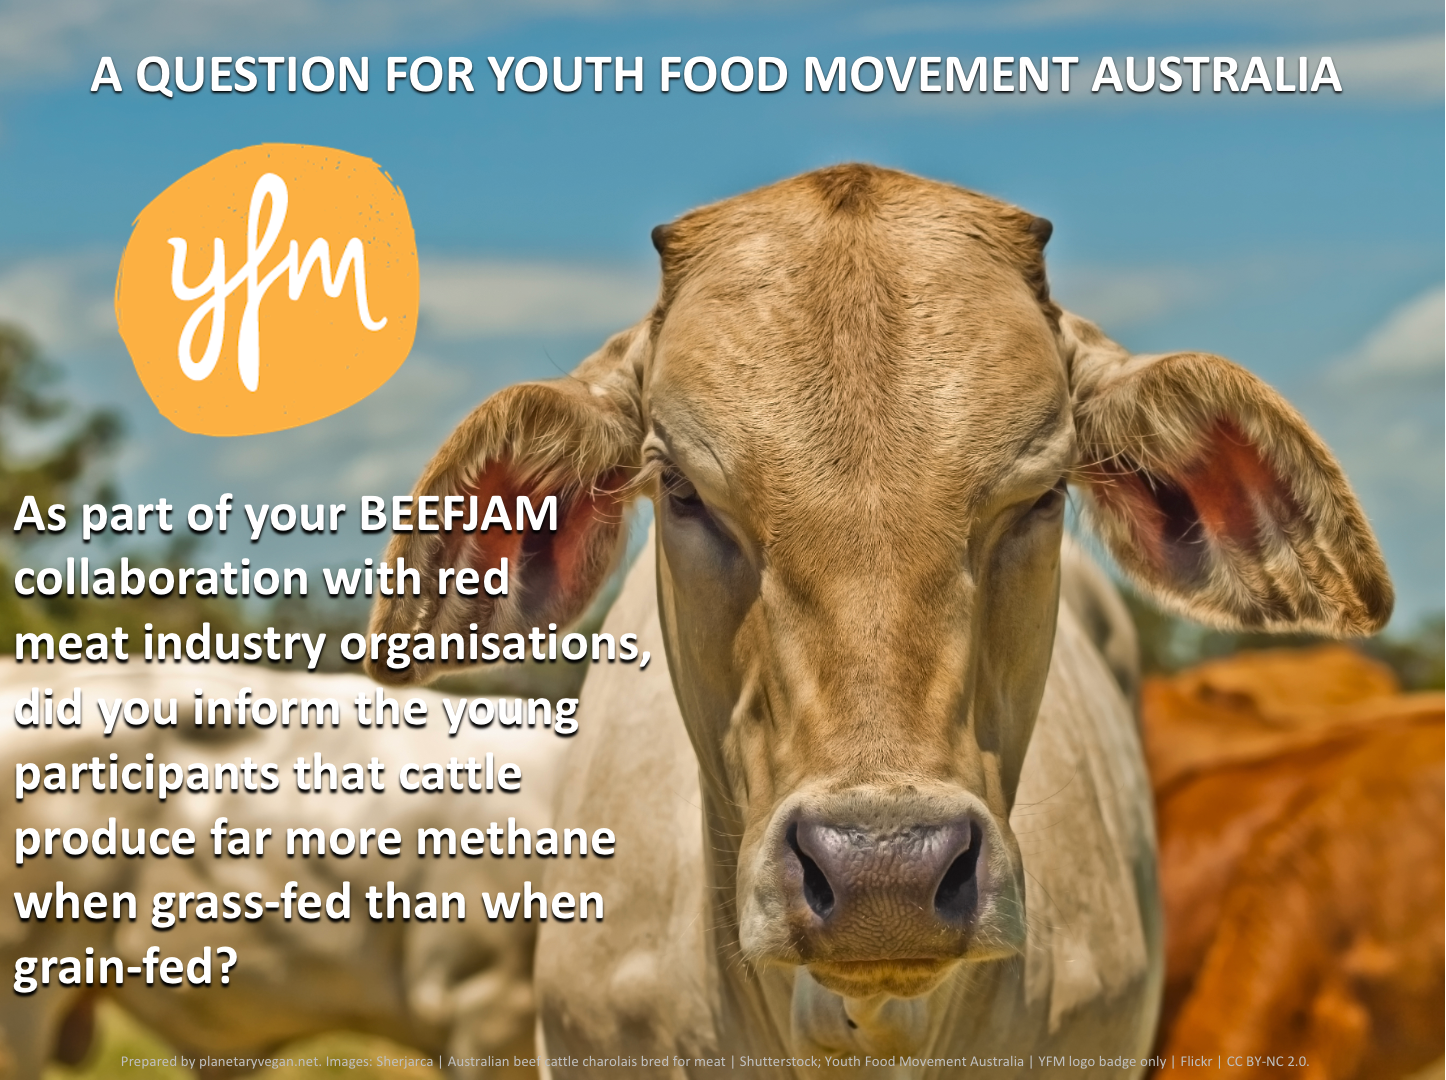
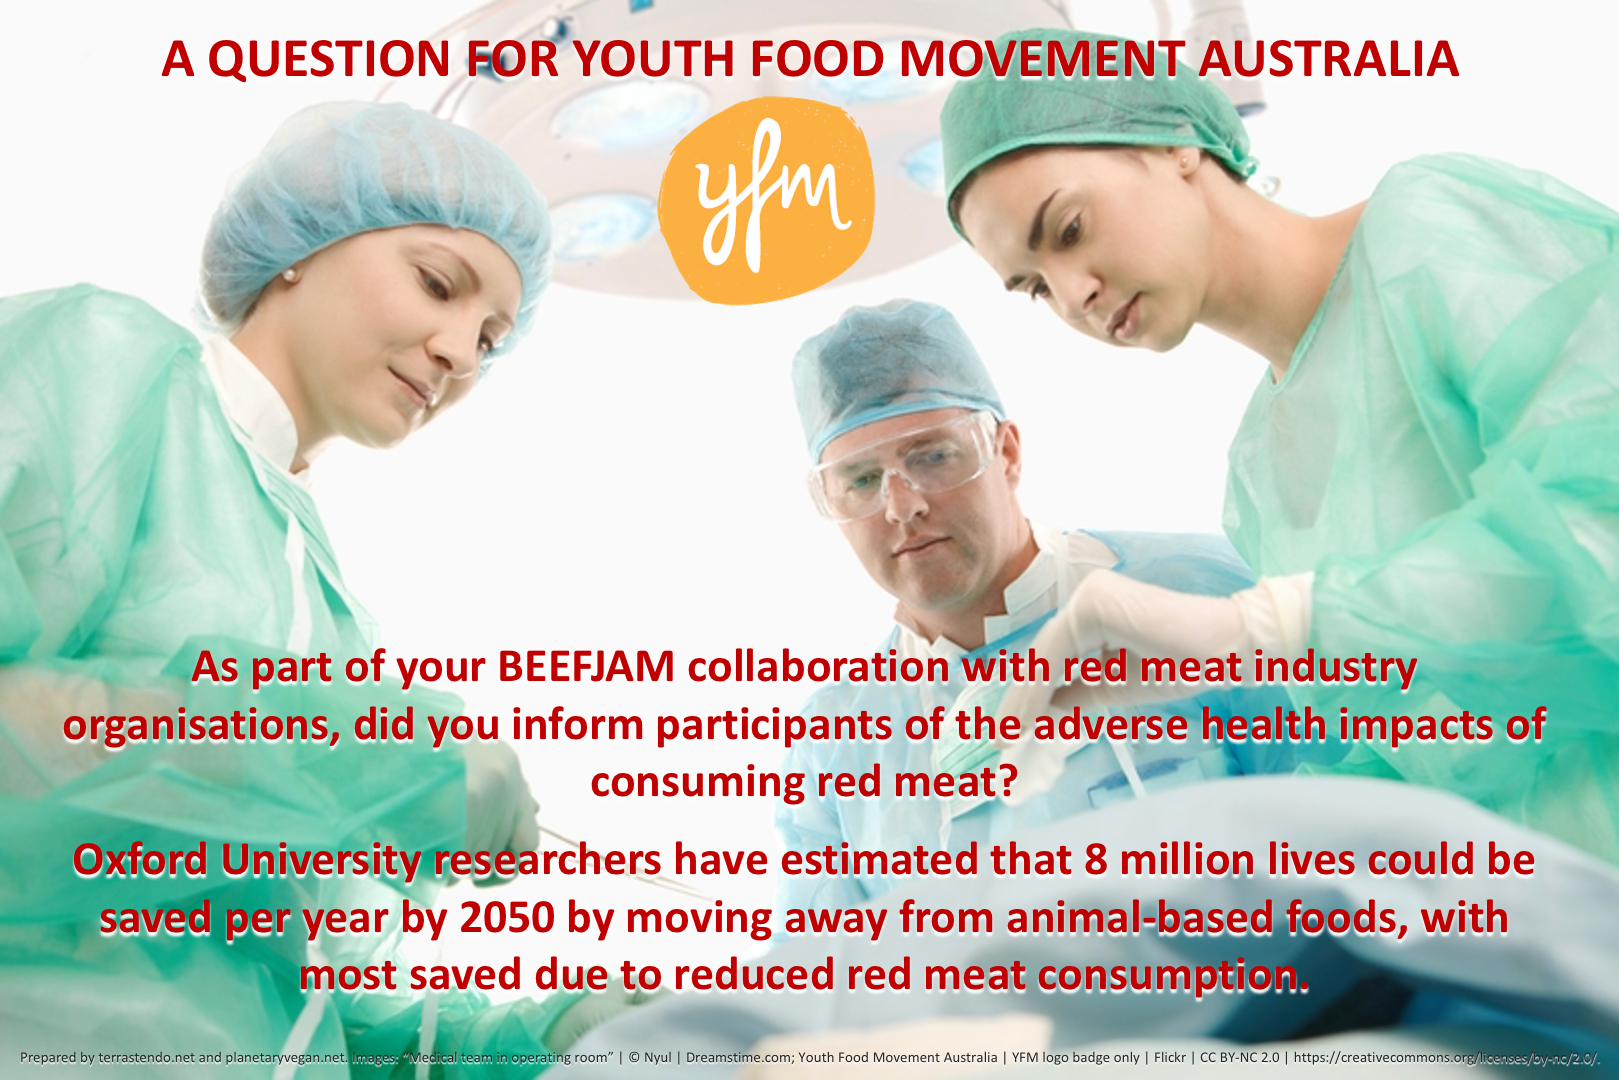
THE MEAT INDUSTRY IN THE CLASSROOM

HANDOUT – AUSTRALIAN ENVIRONMENTAL IMPACTS

HEALTH (WITH RELEVANCE TO ANIMAL RIGHTS)
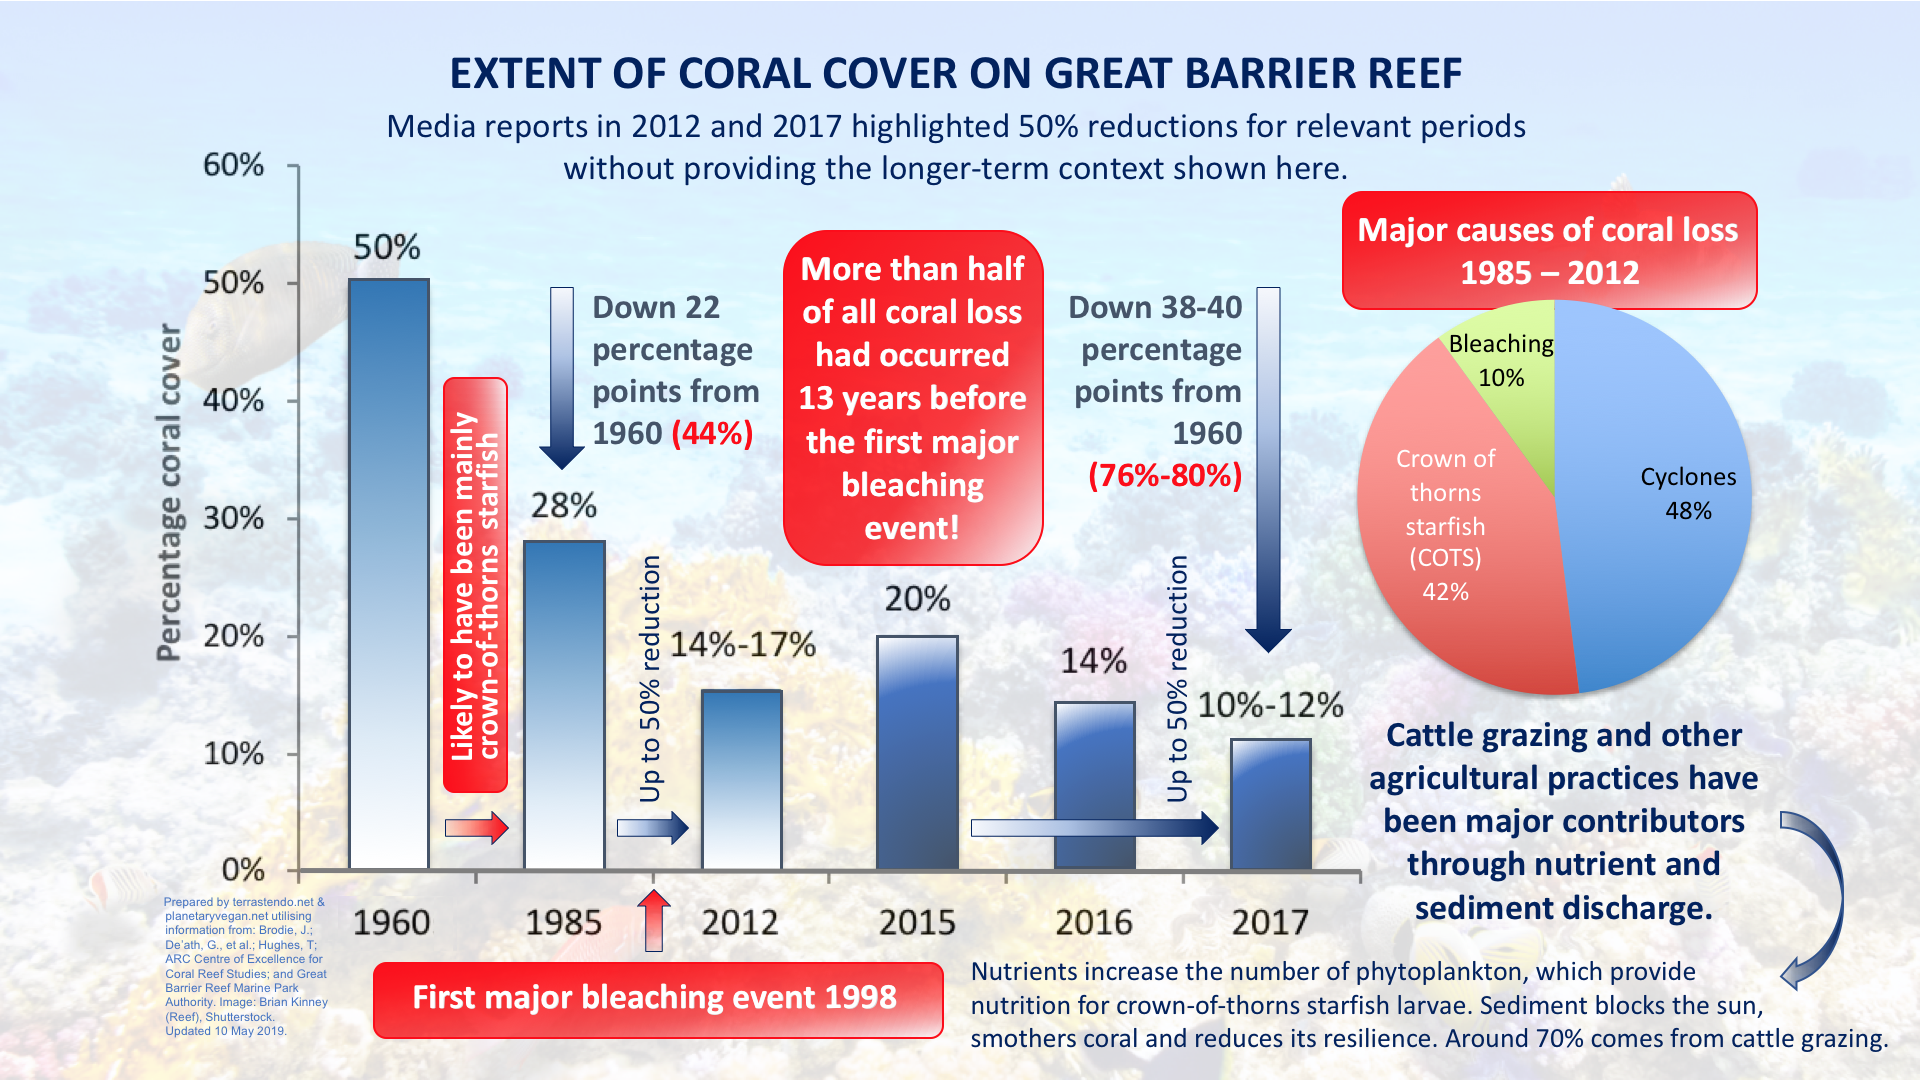
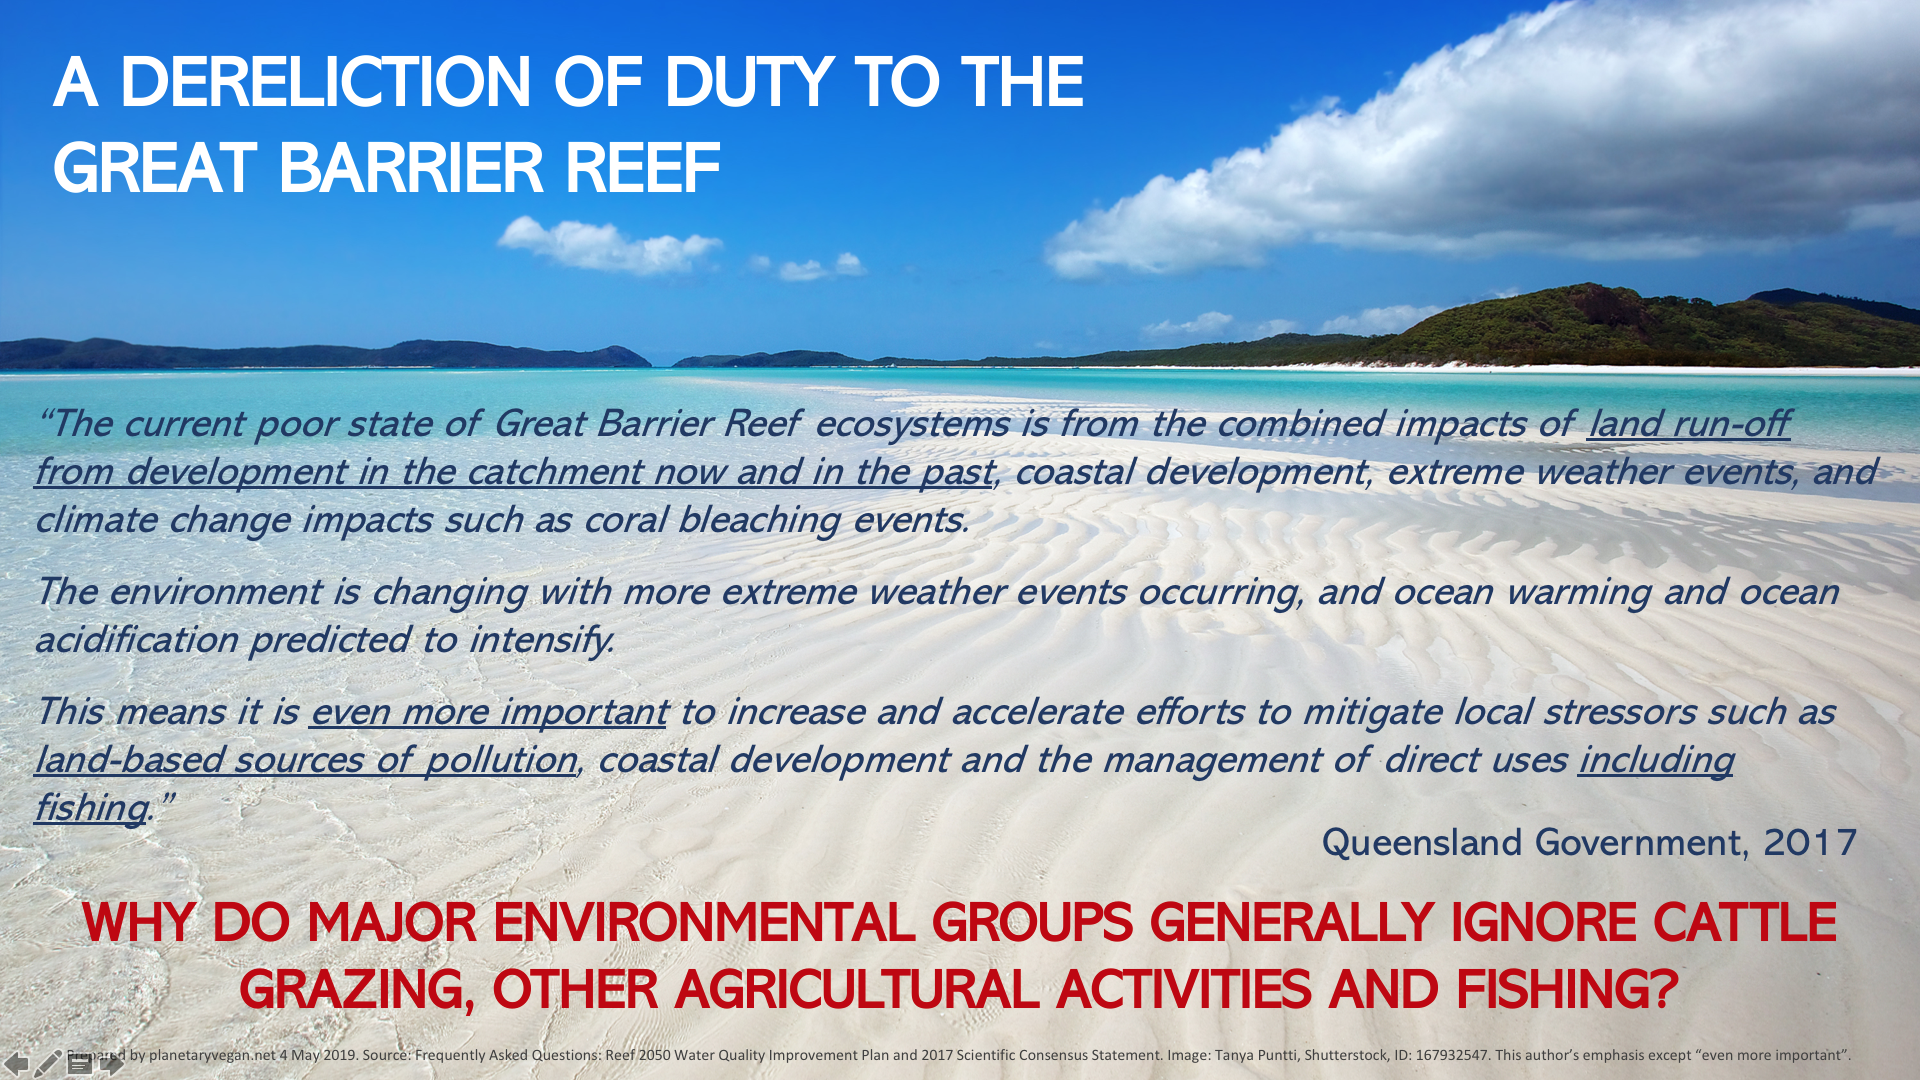
THE GREAT BARRIER REEF AND THE IMPACT OF ANIMAL AGRICULTURE

Creative Commons licence for the above image: CC BY-SA 2.0
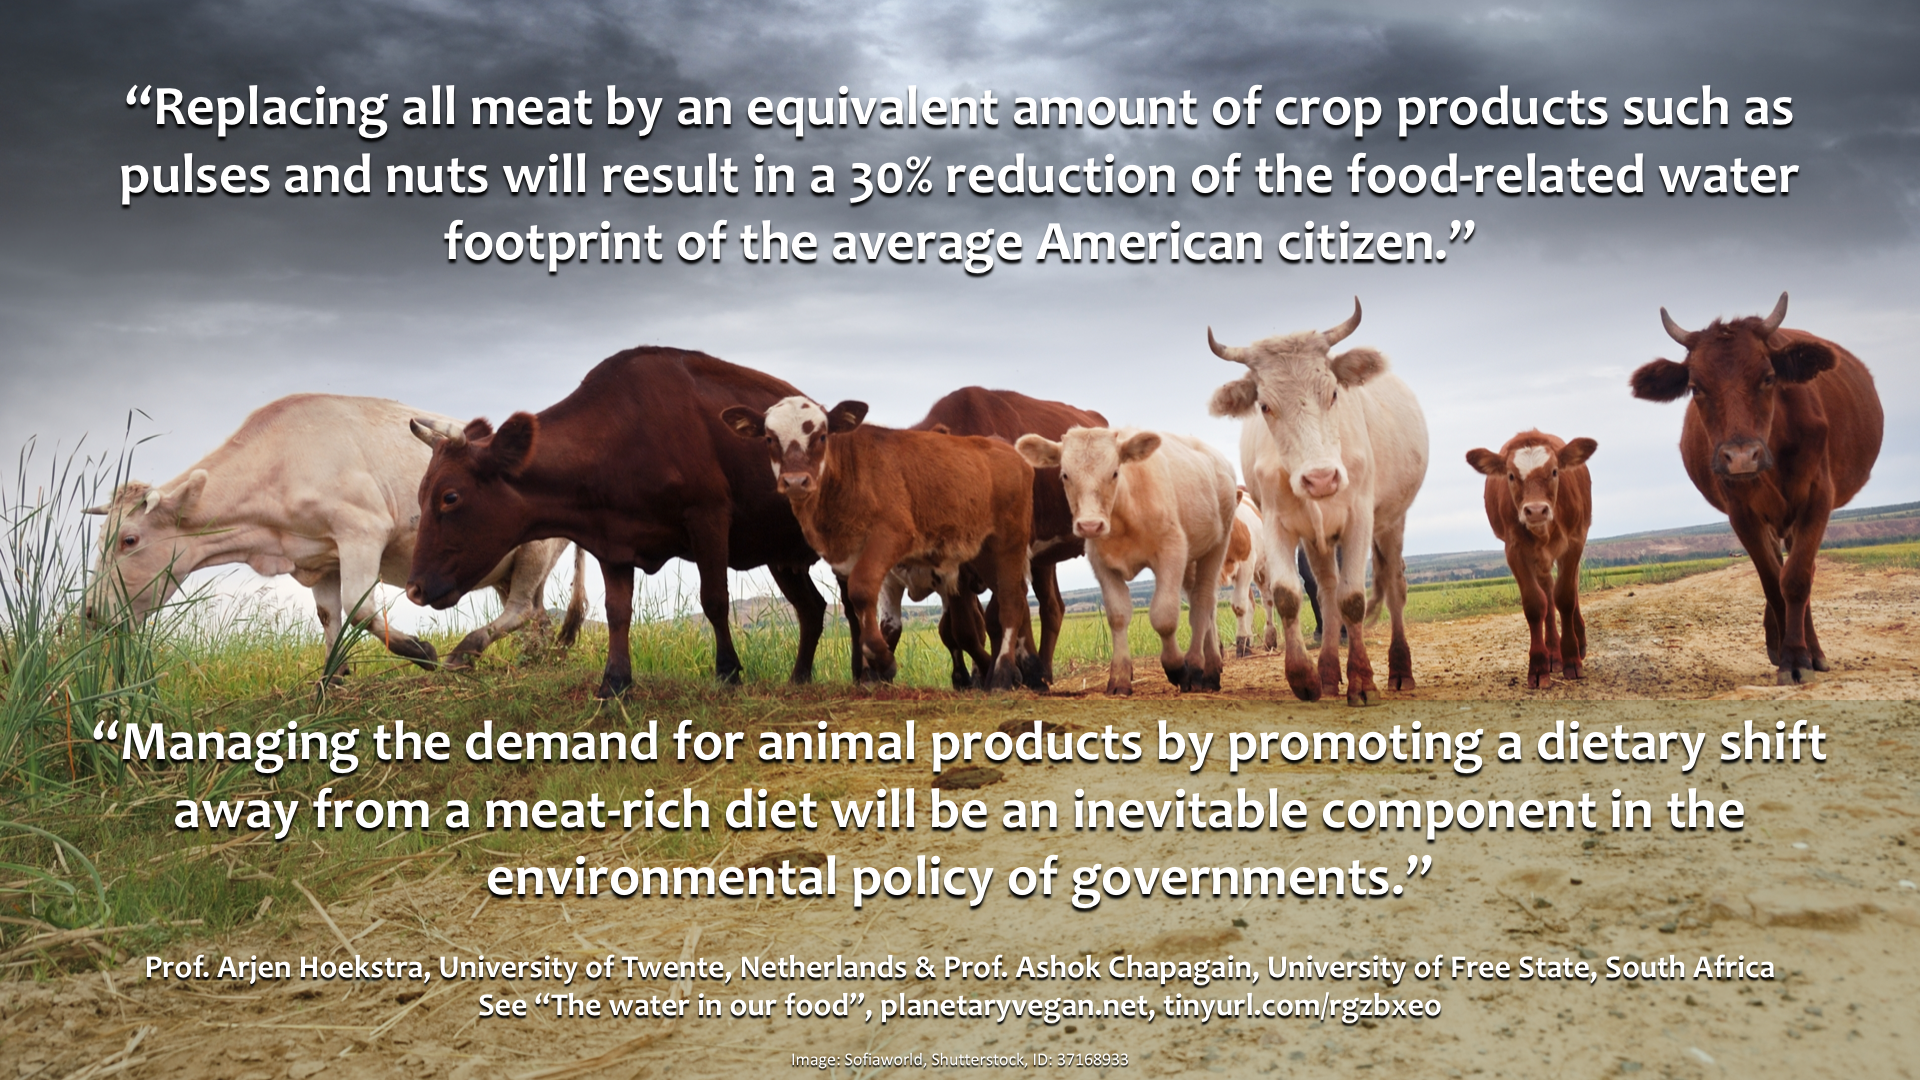
WATER IN FOOD
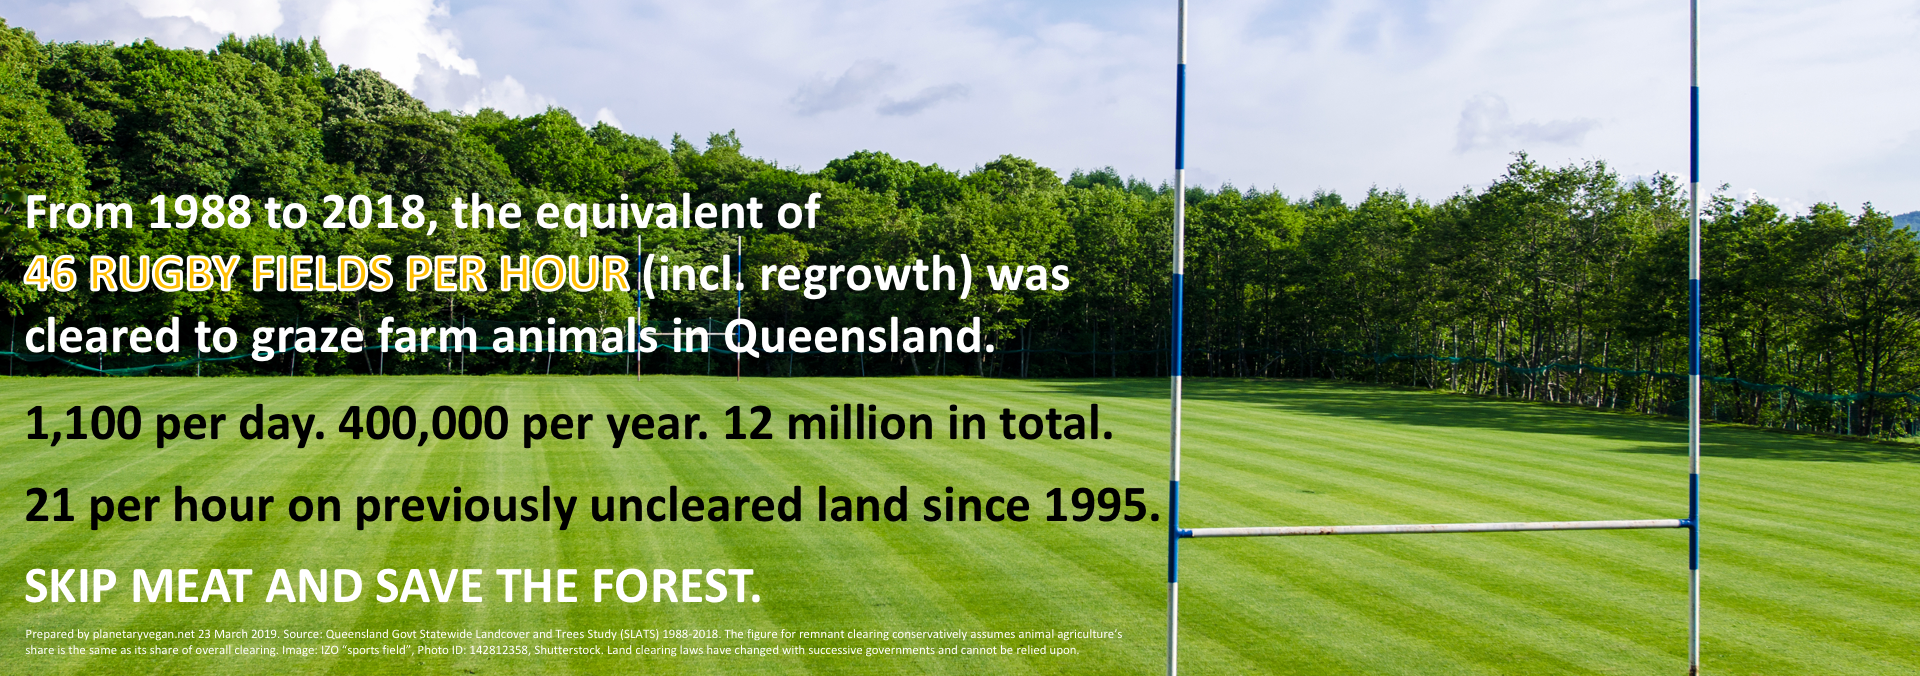
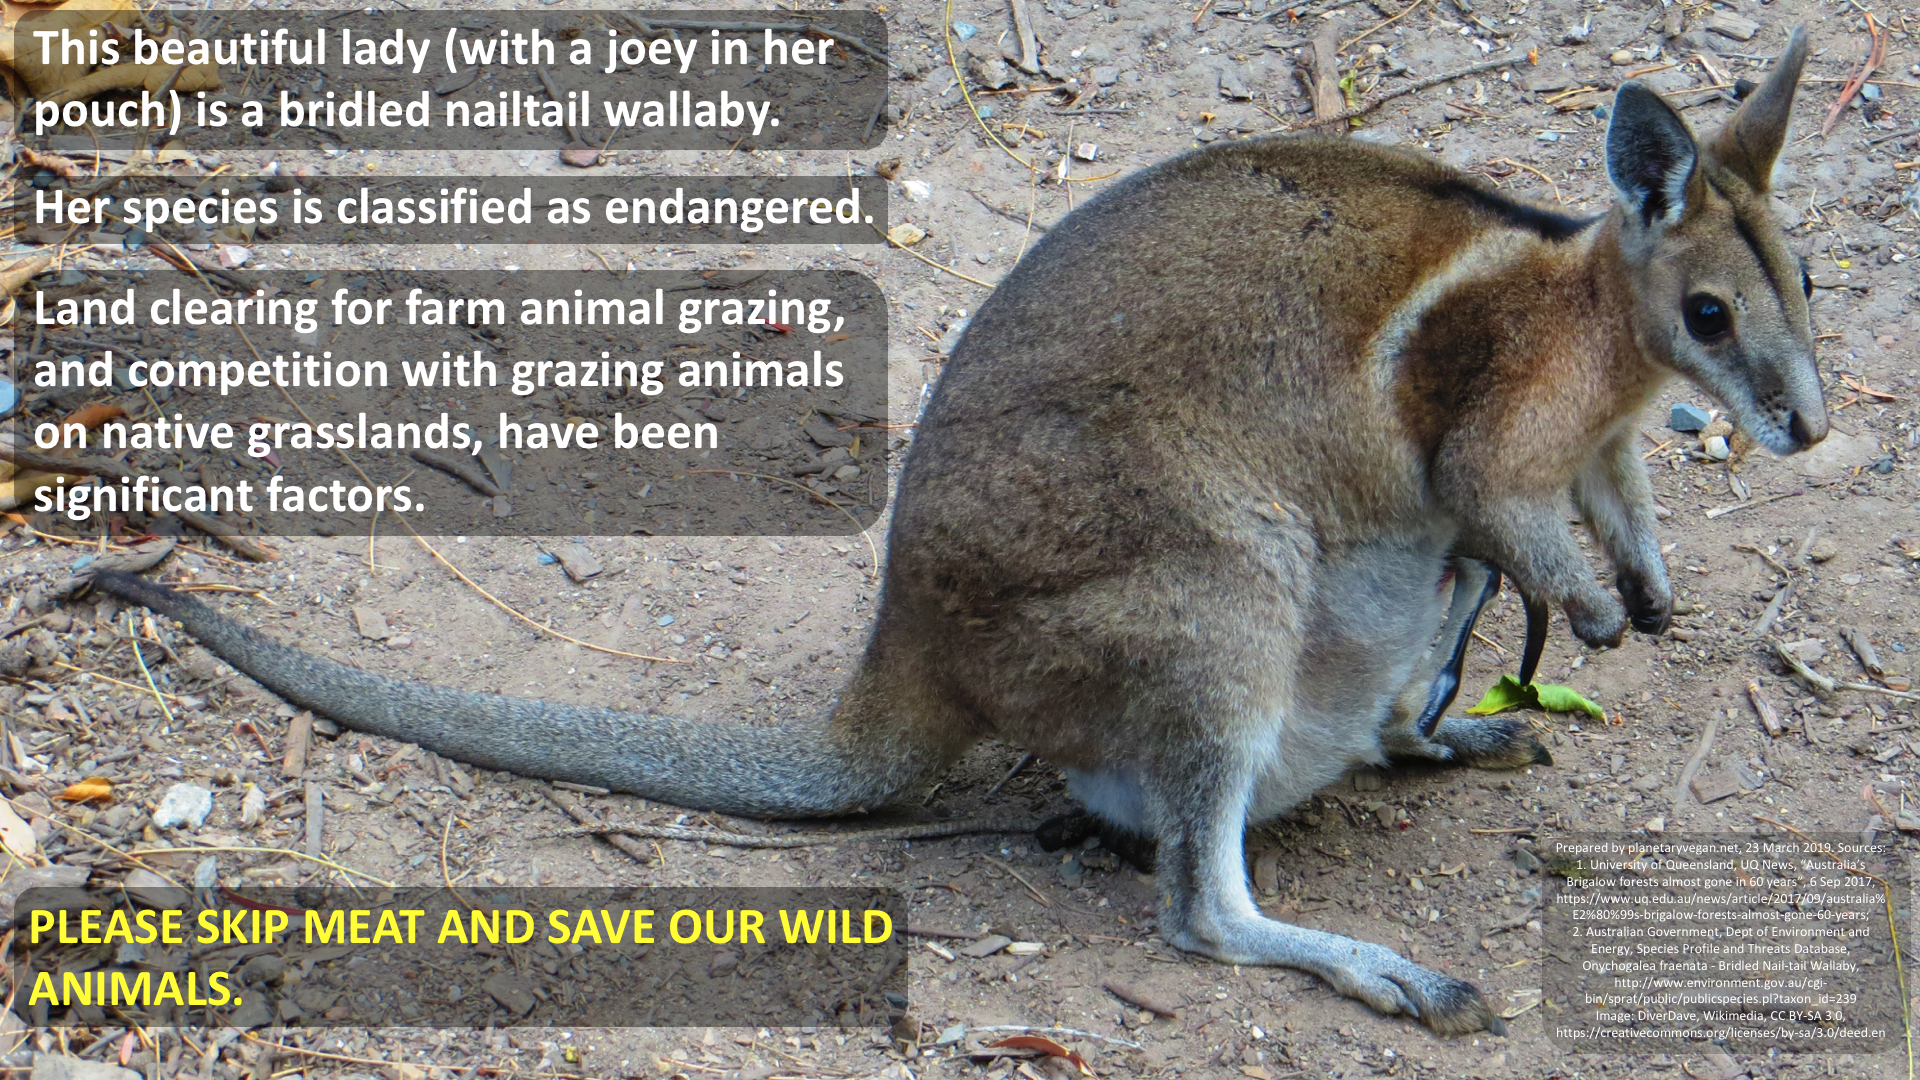
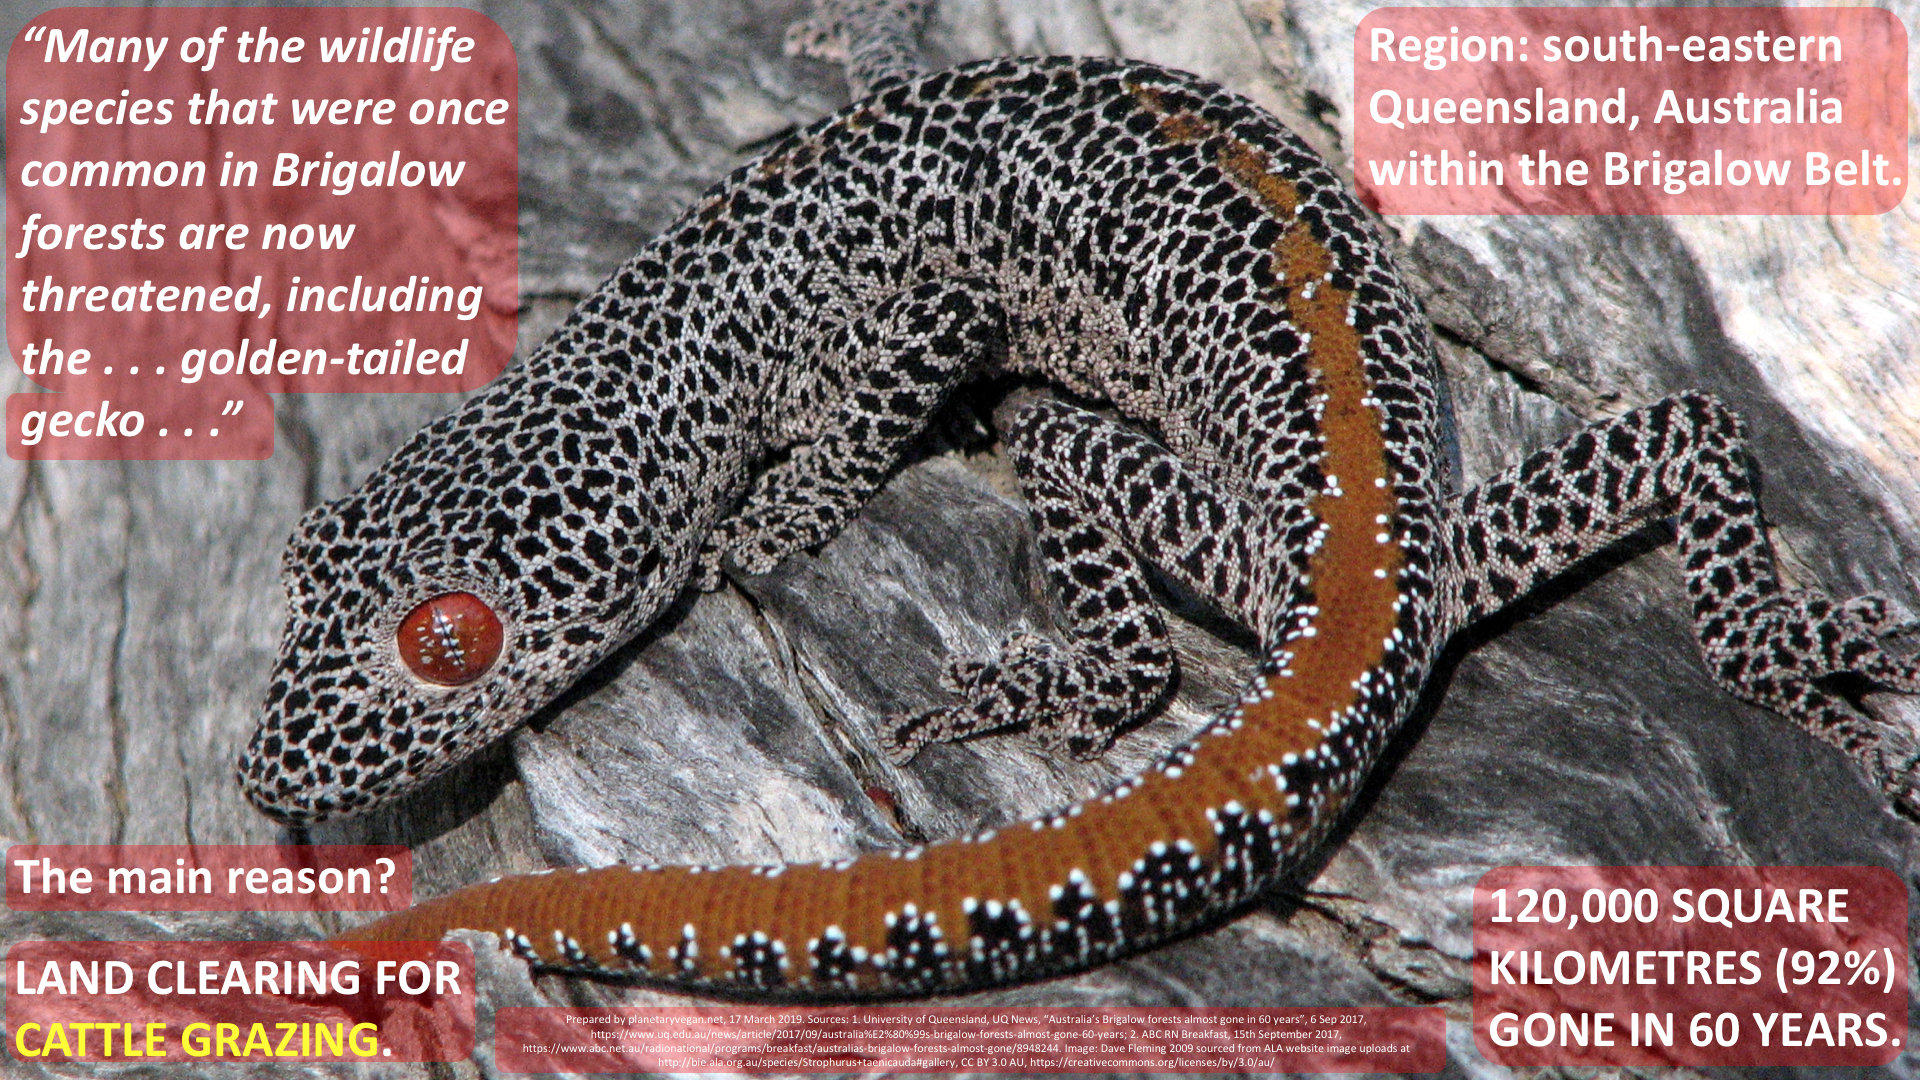
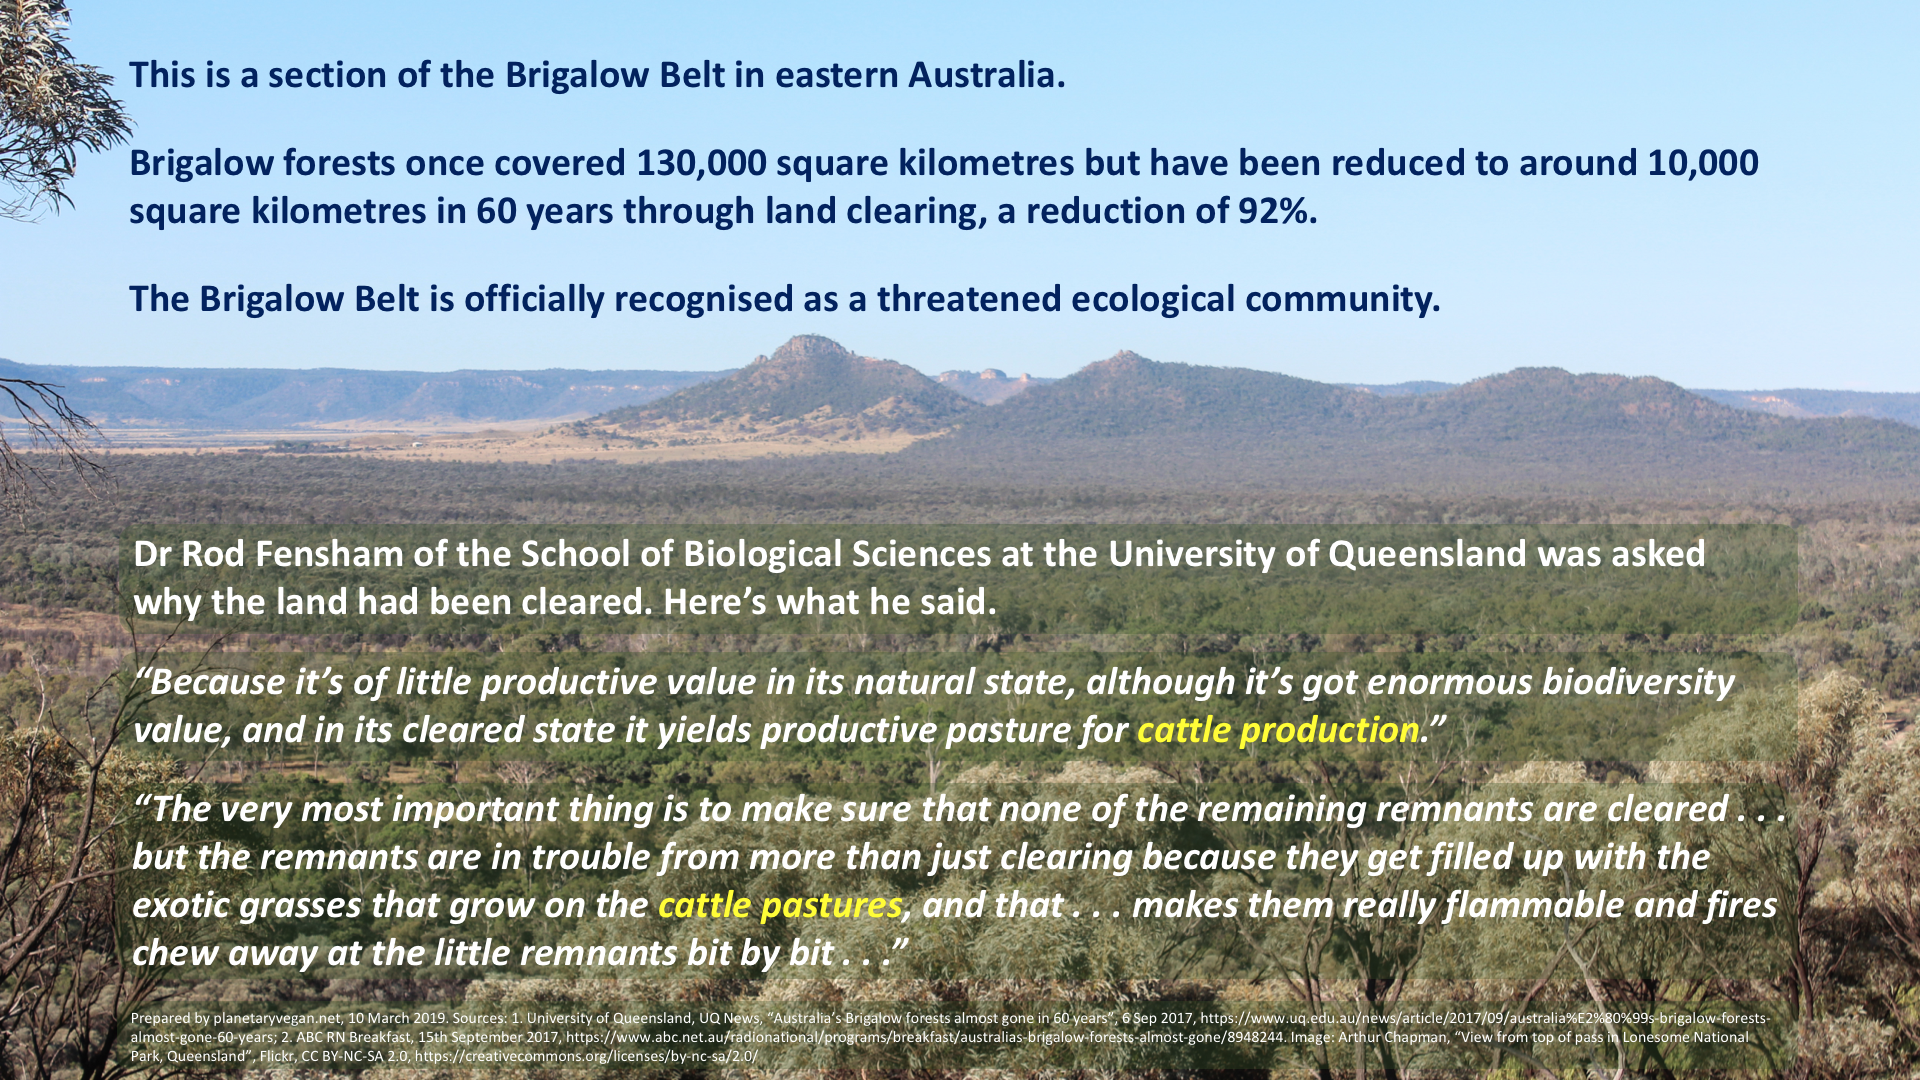
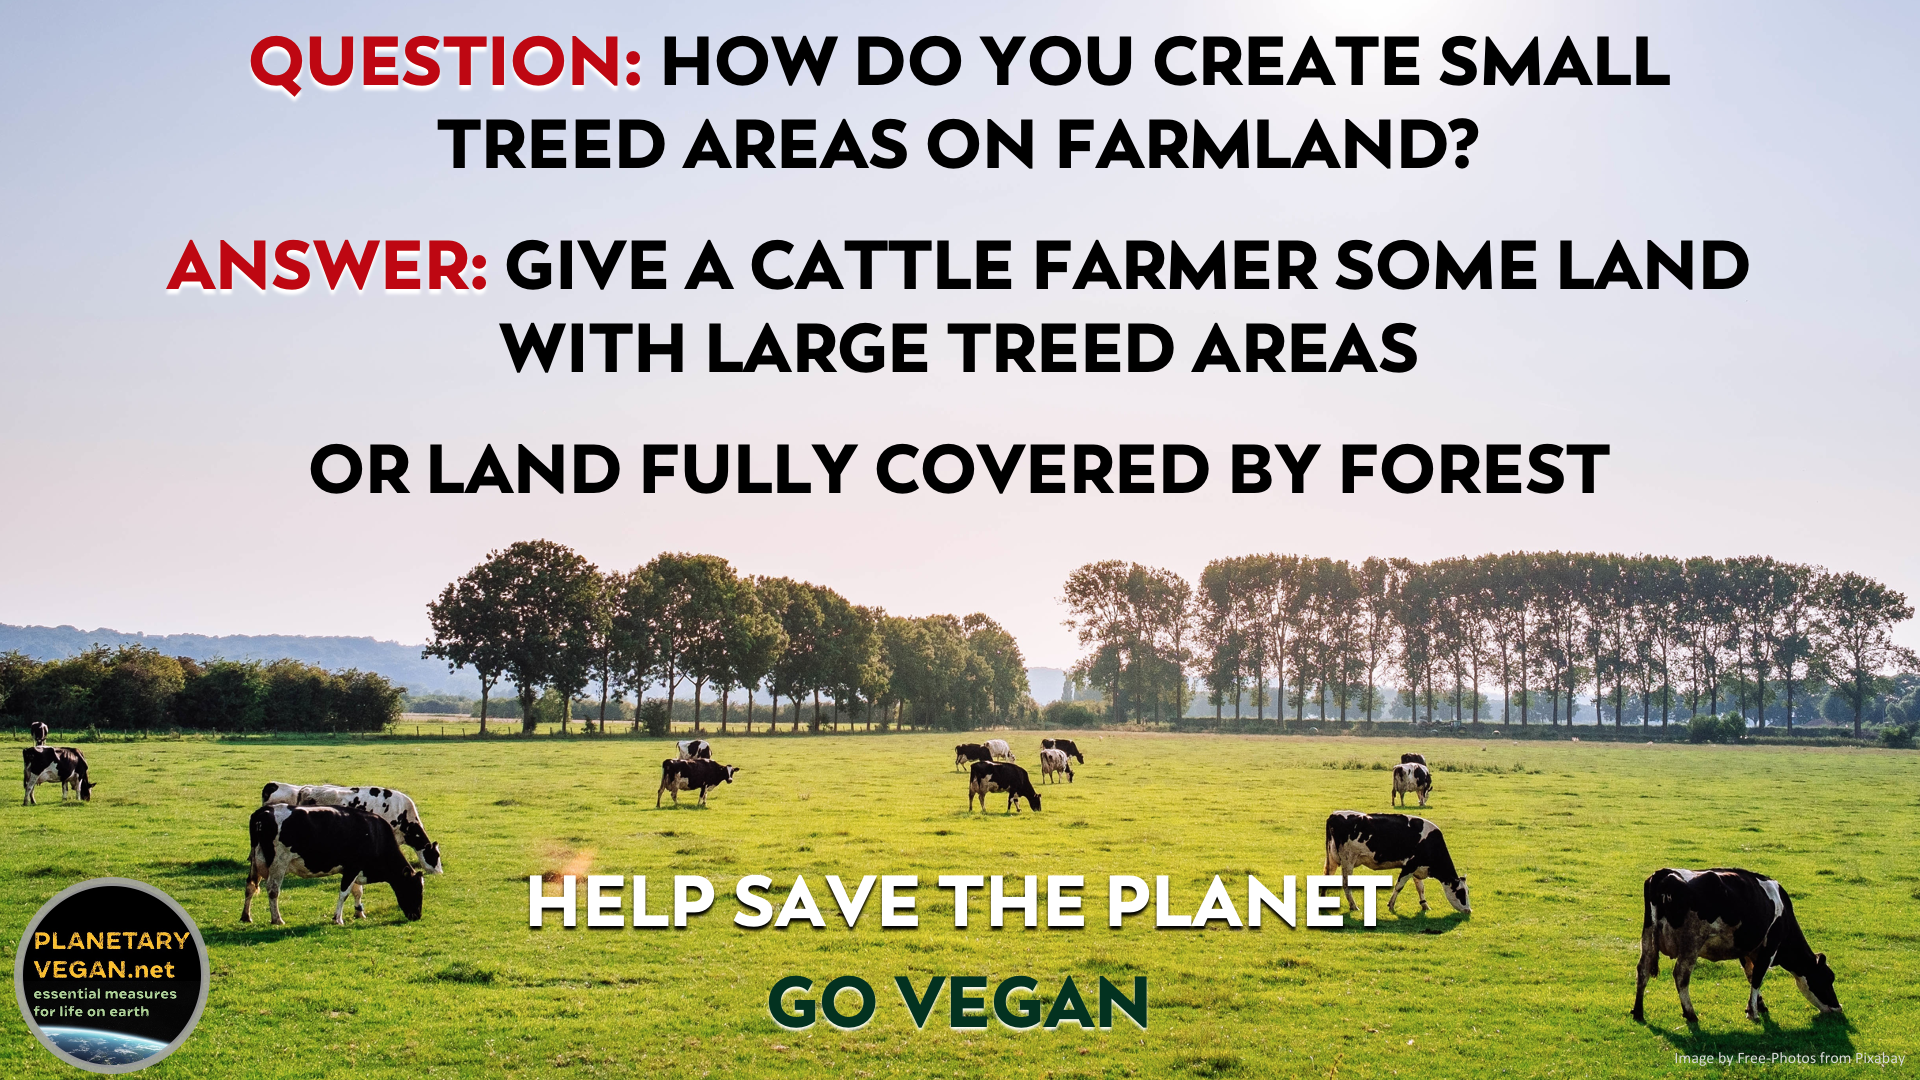
LIVESTOCK-RELATED LAND CLEARING


![]()
![]()


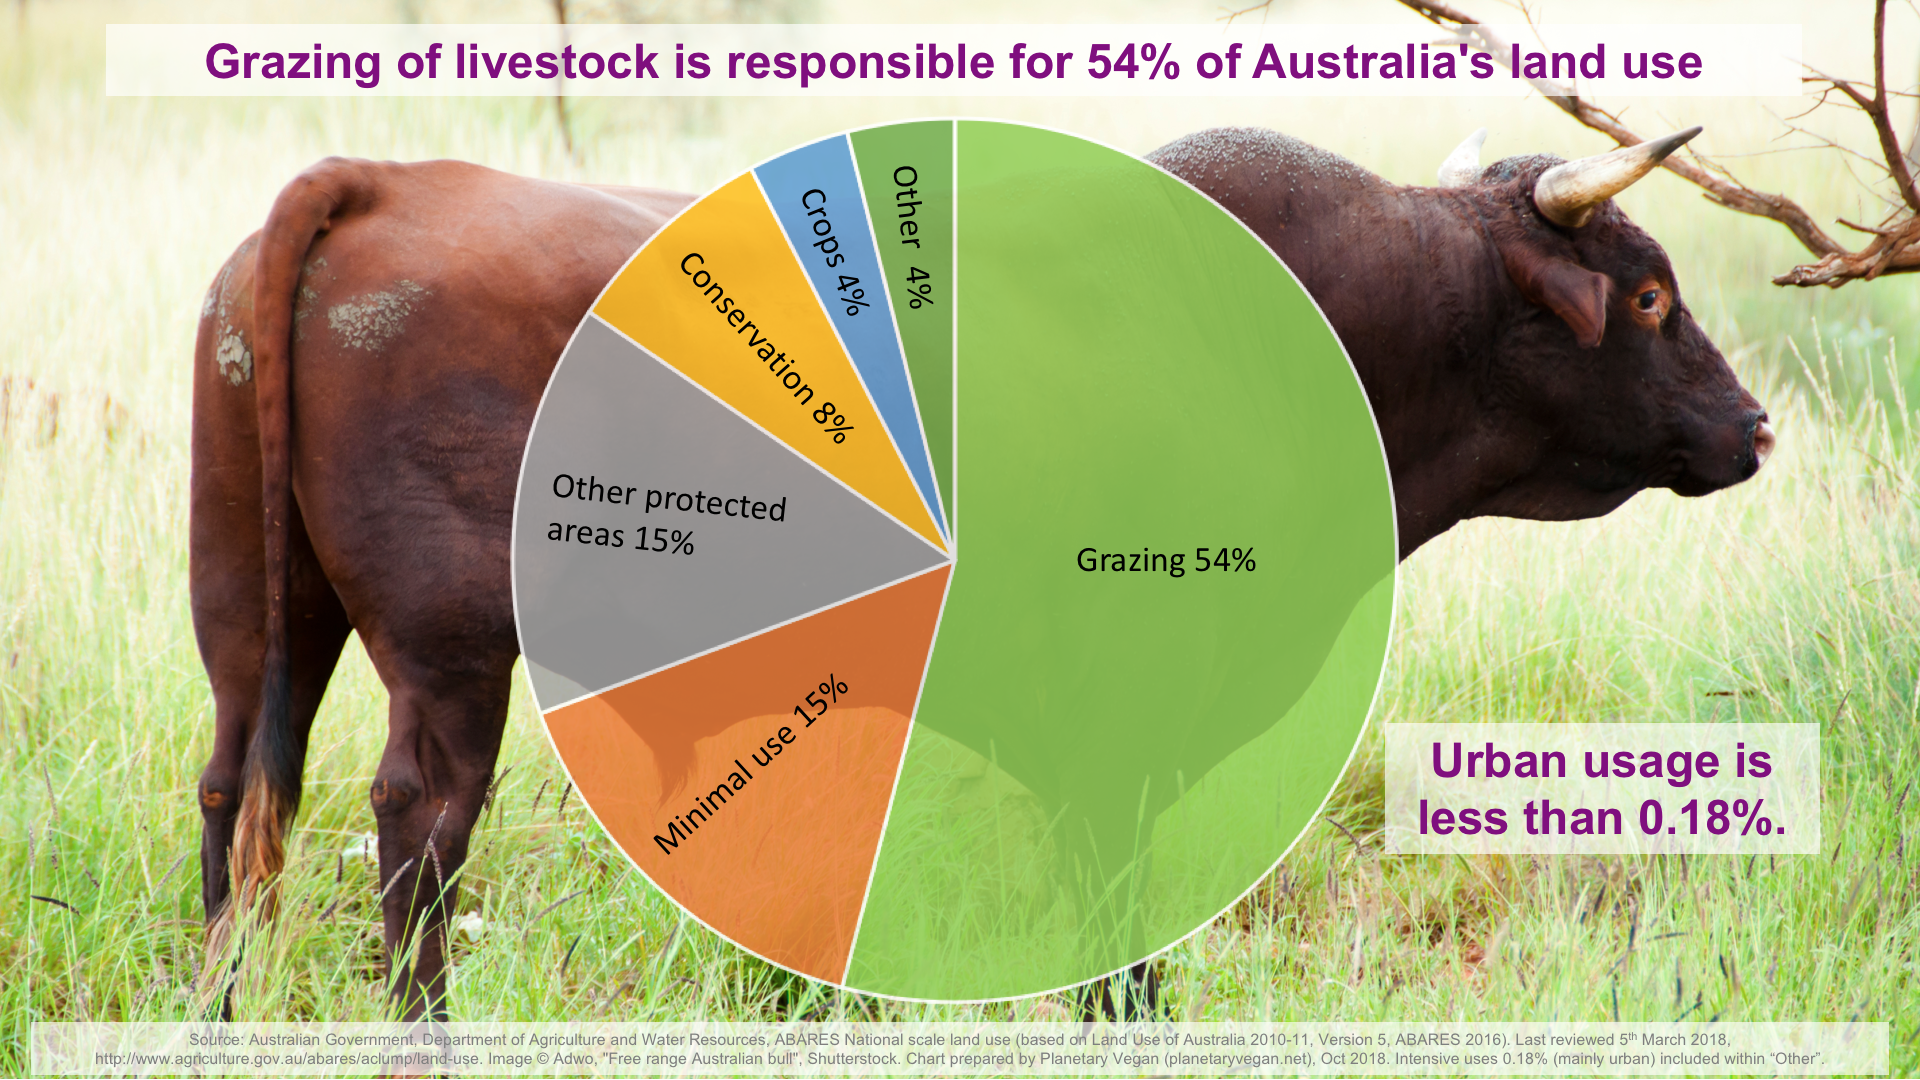
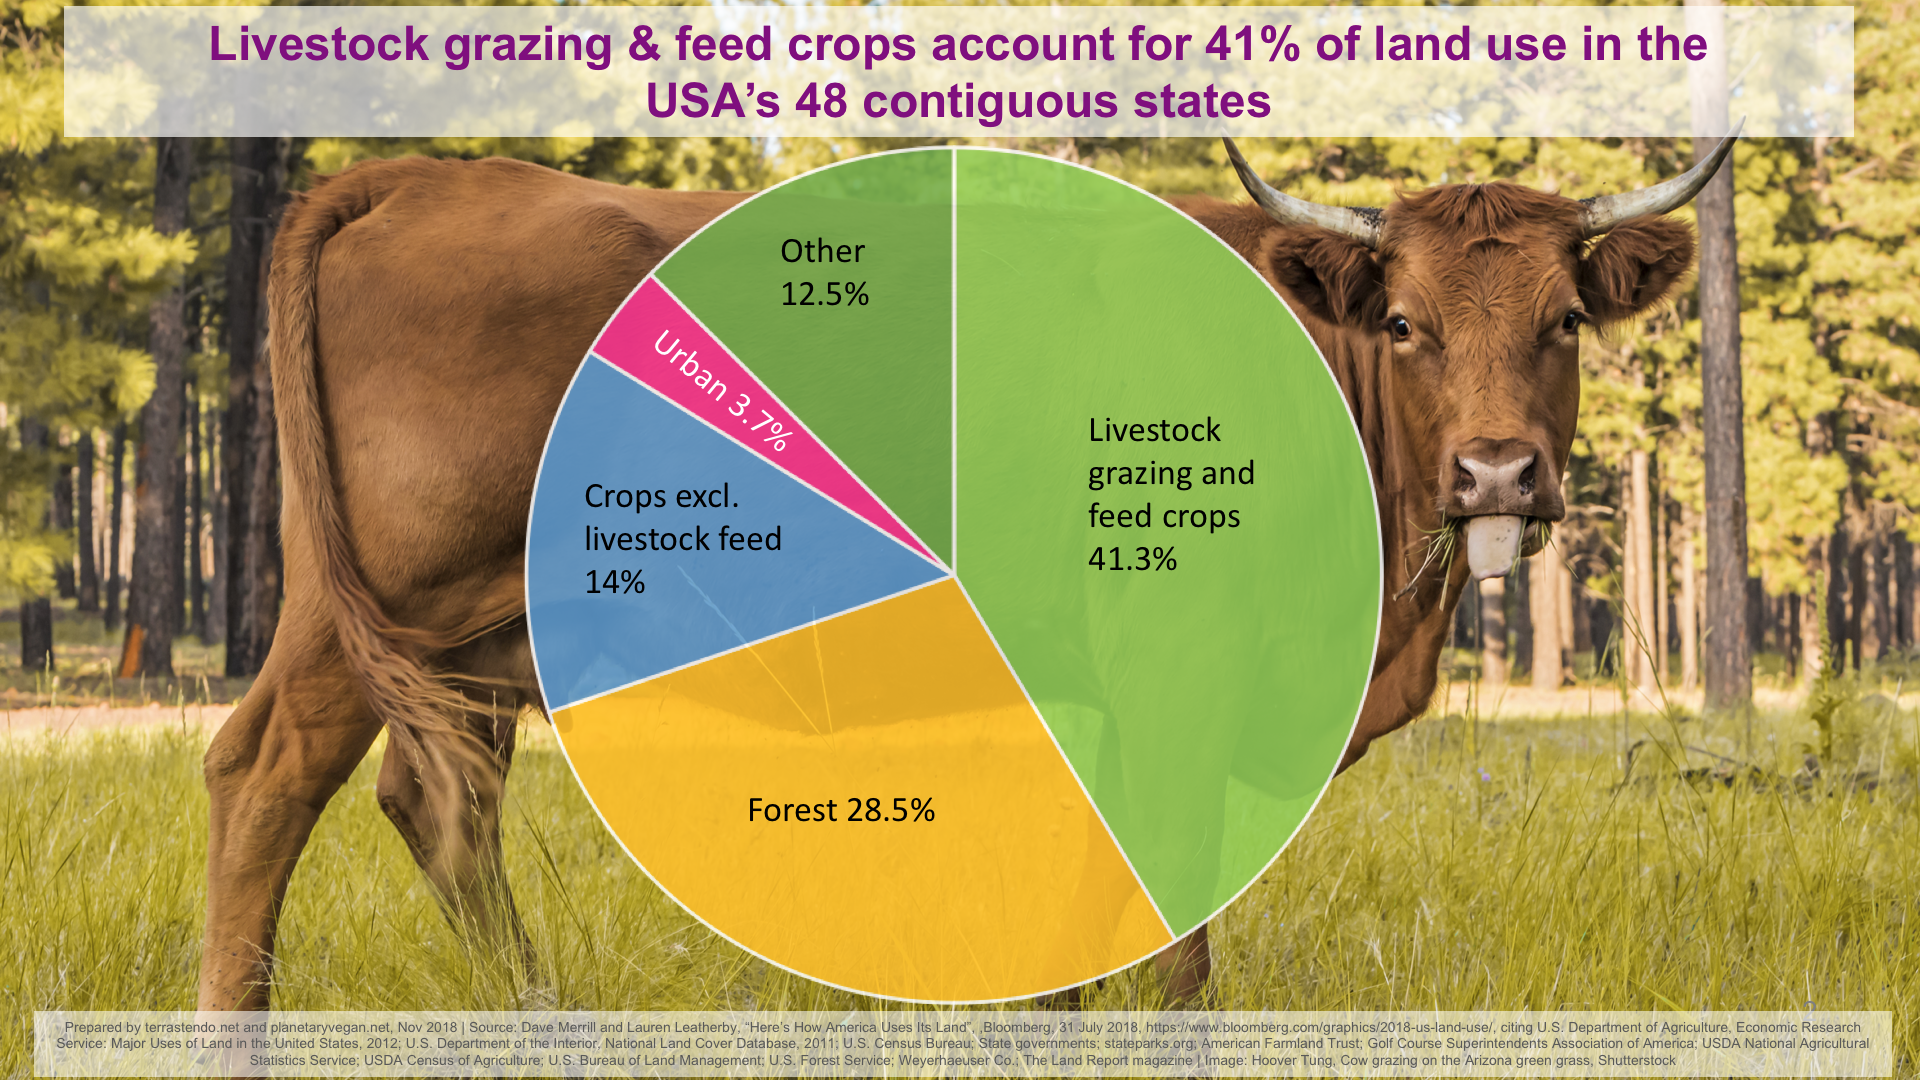
LAND USE
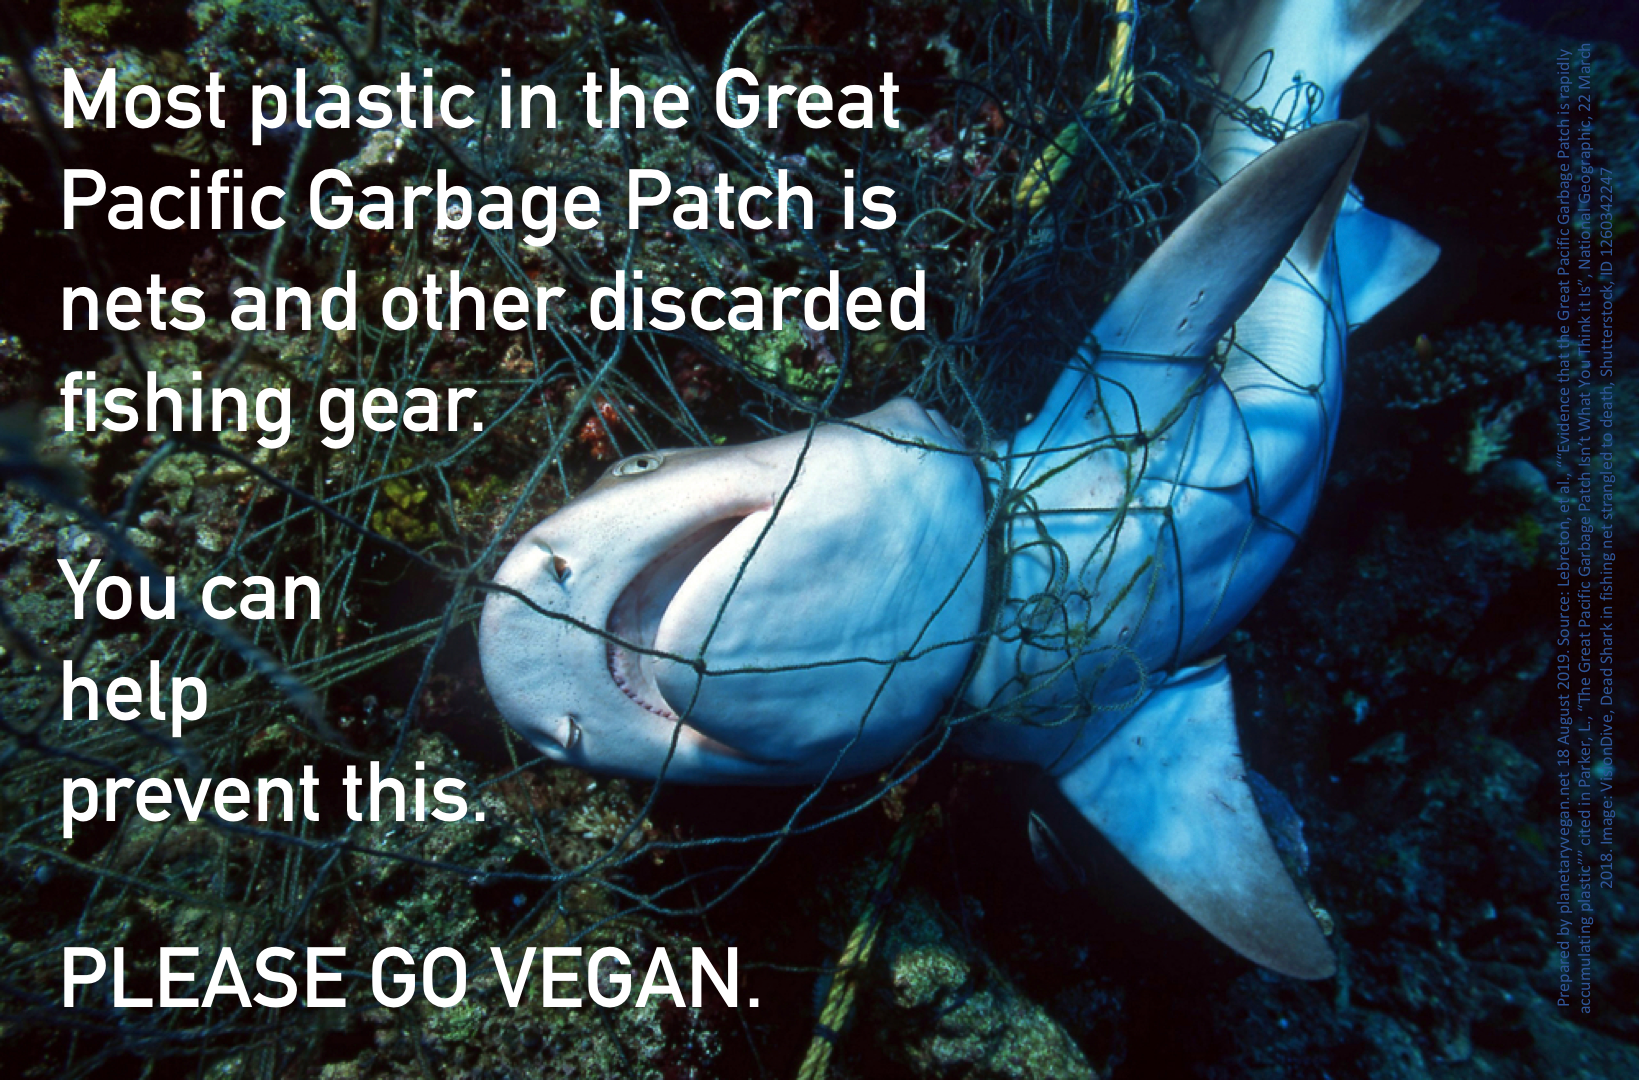
FISHING
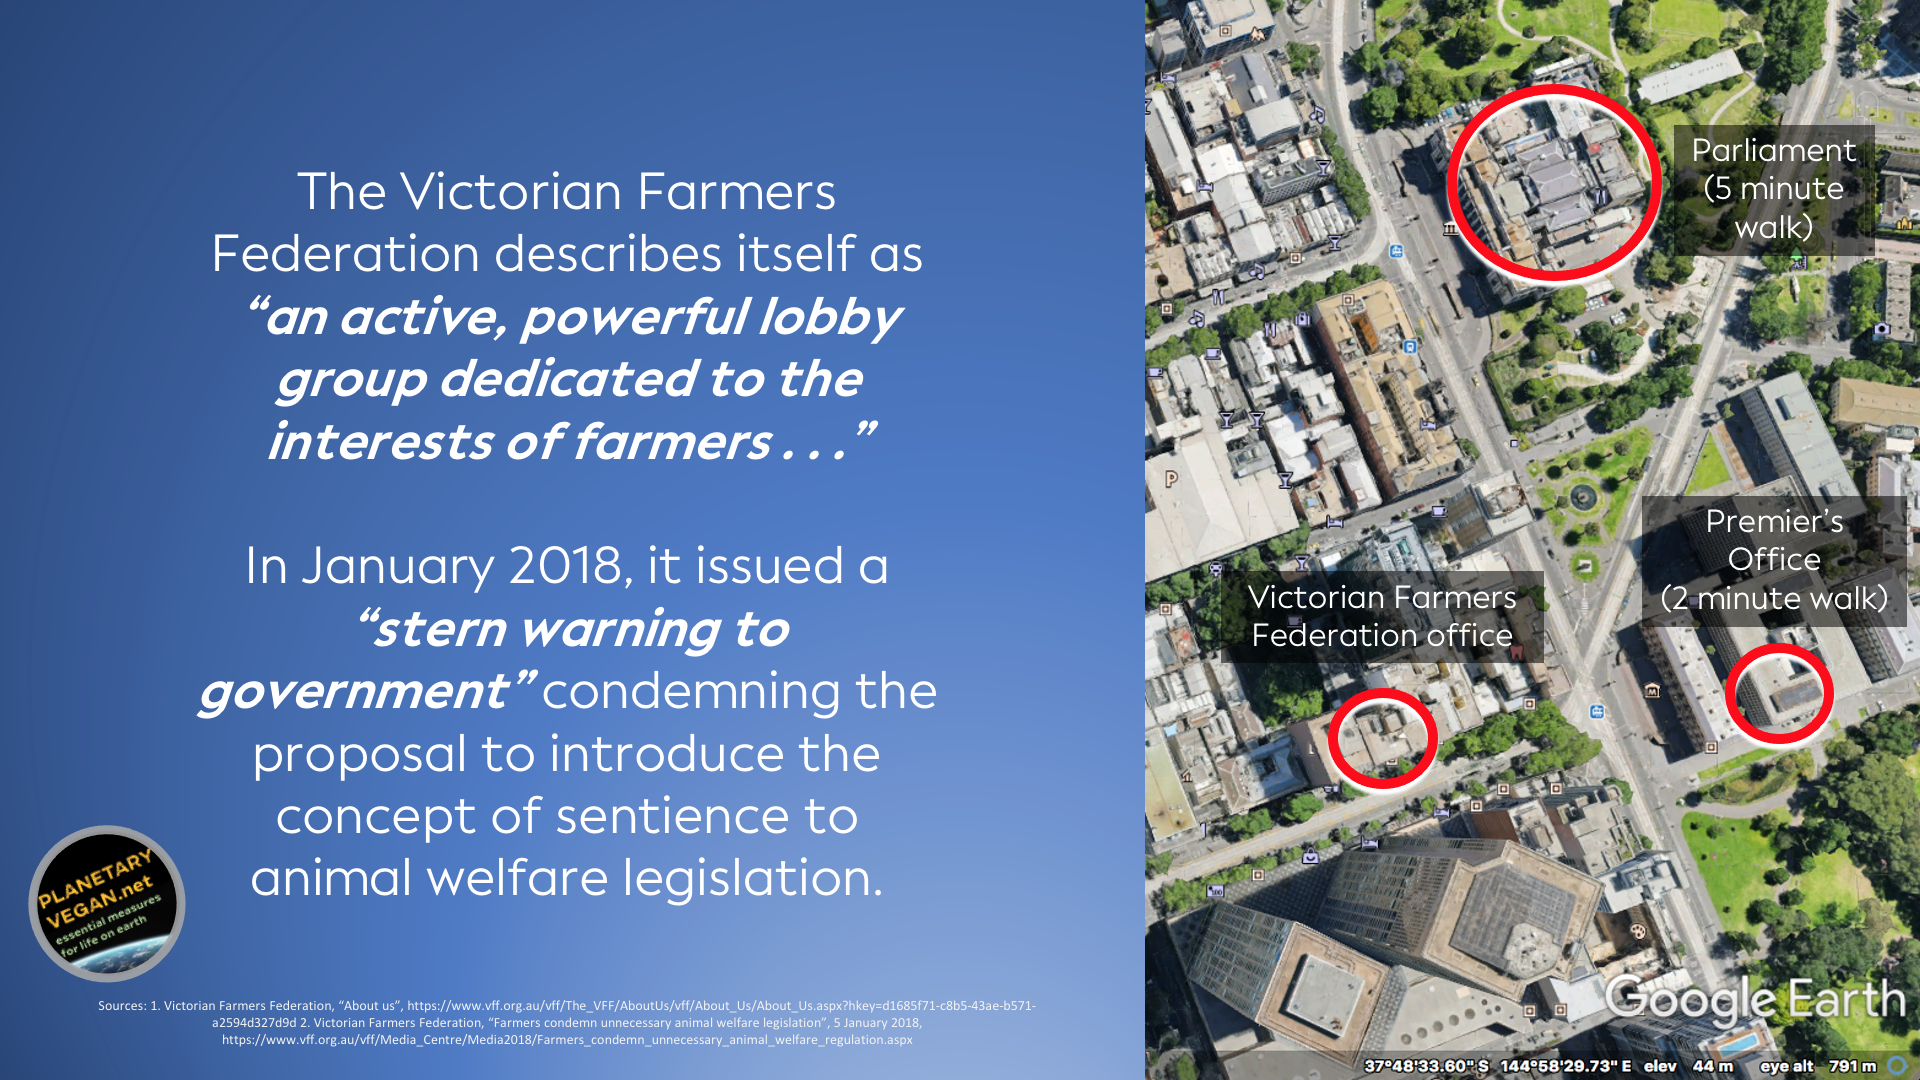
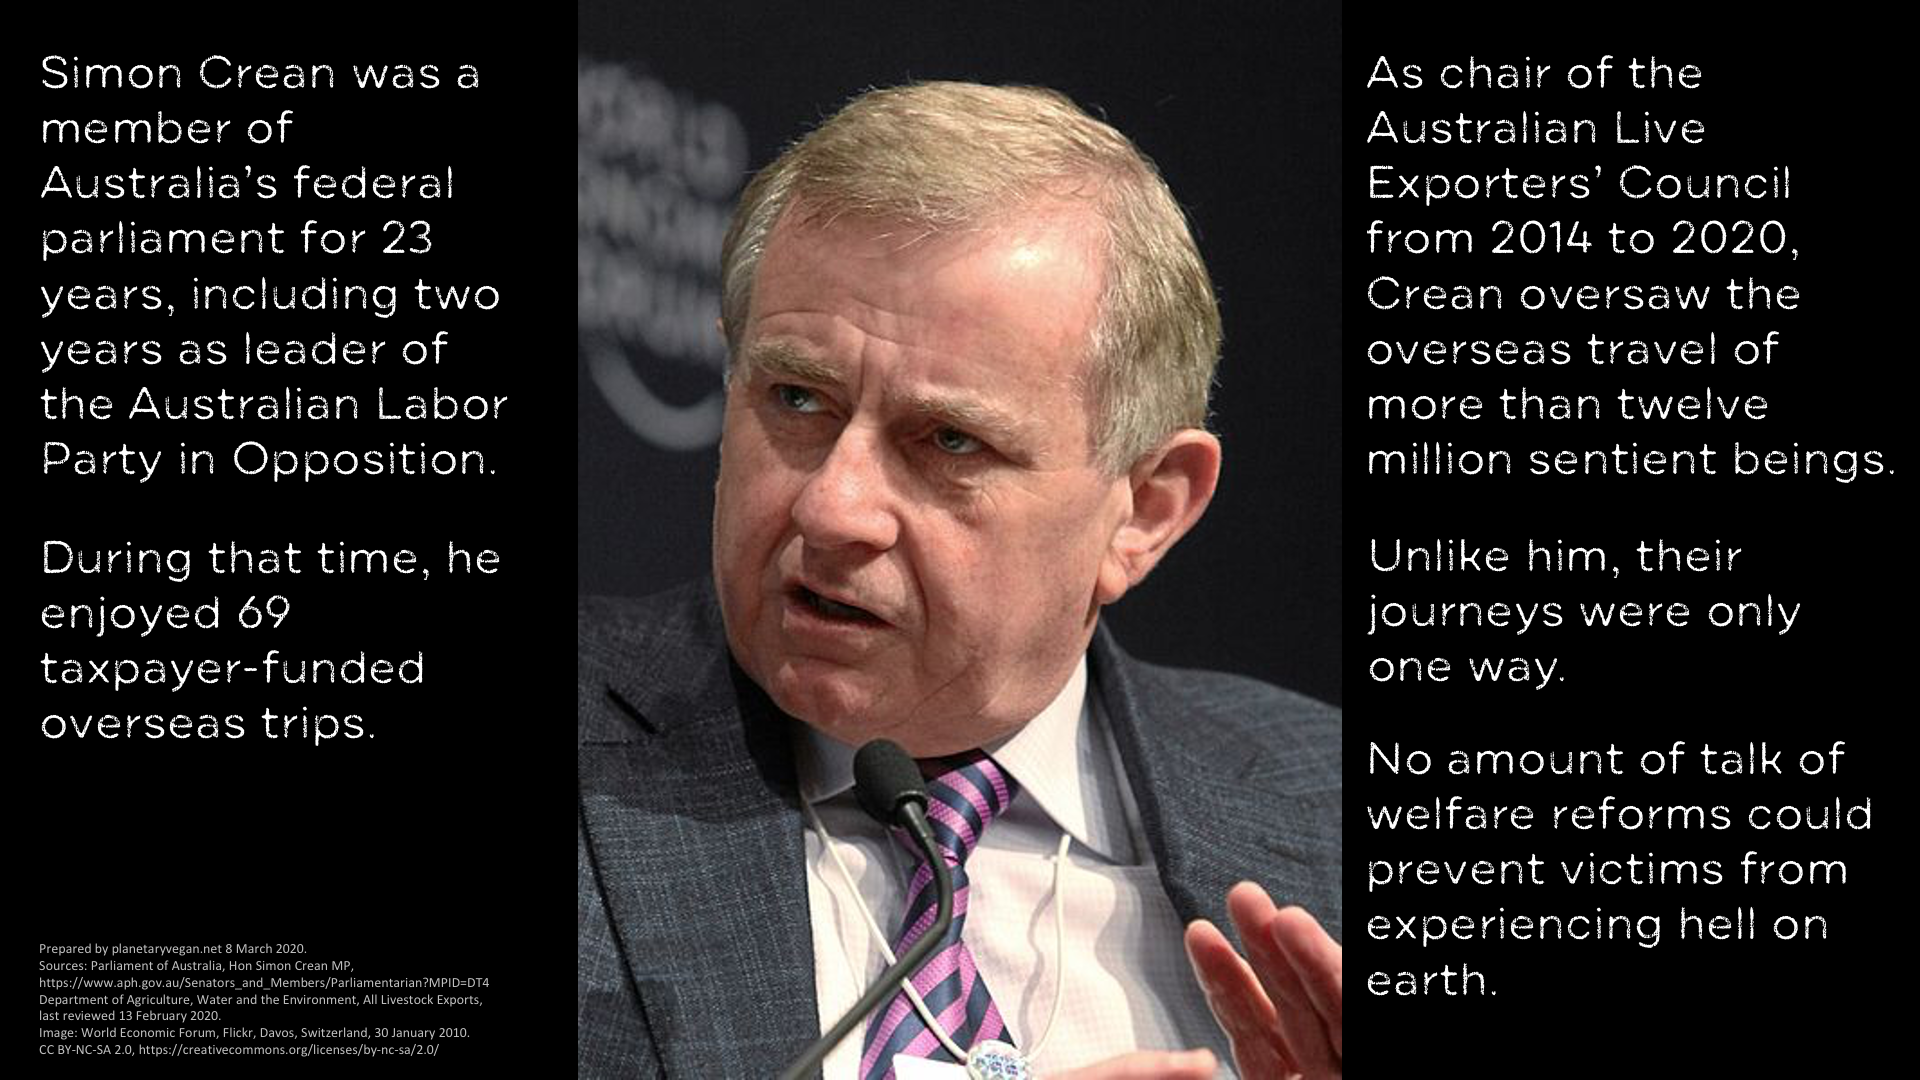
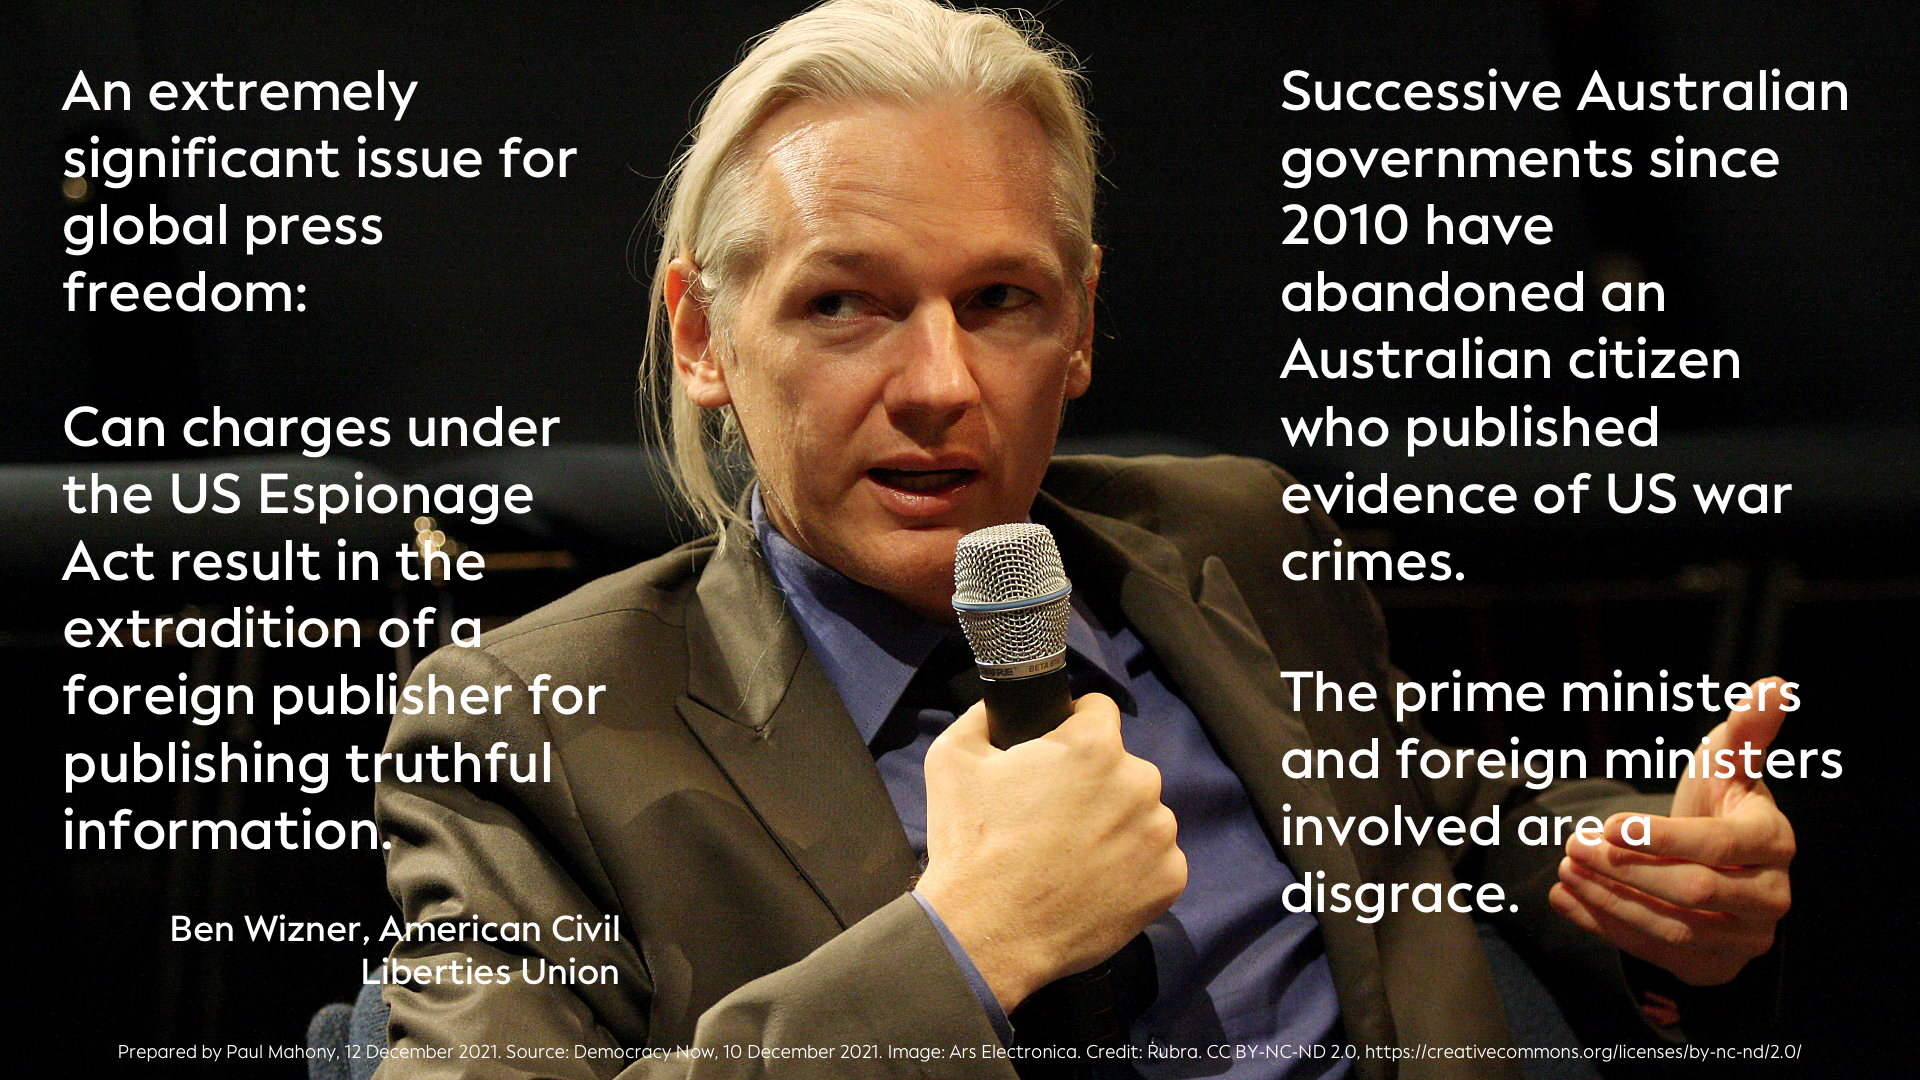
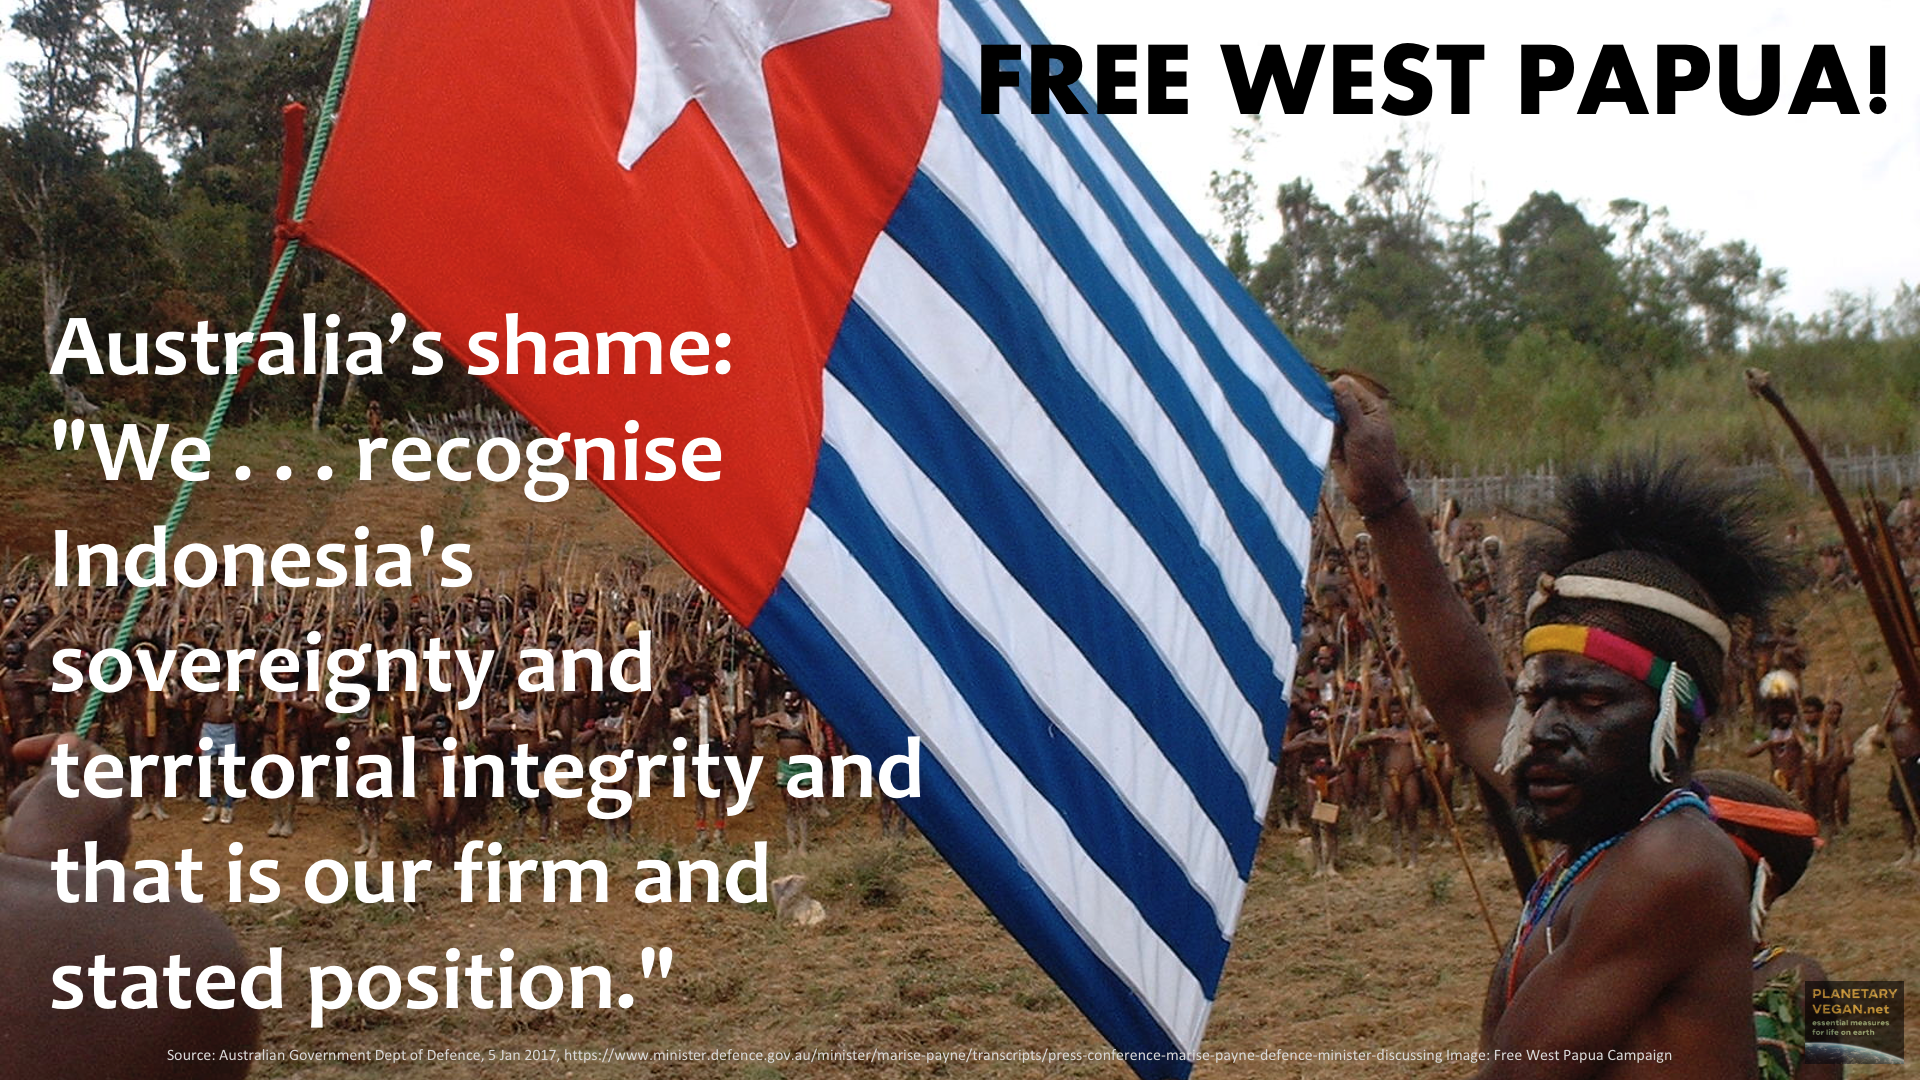
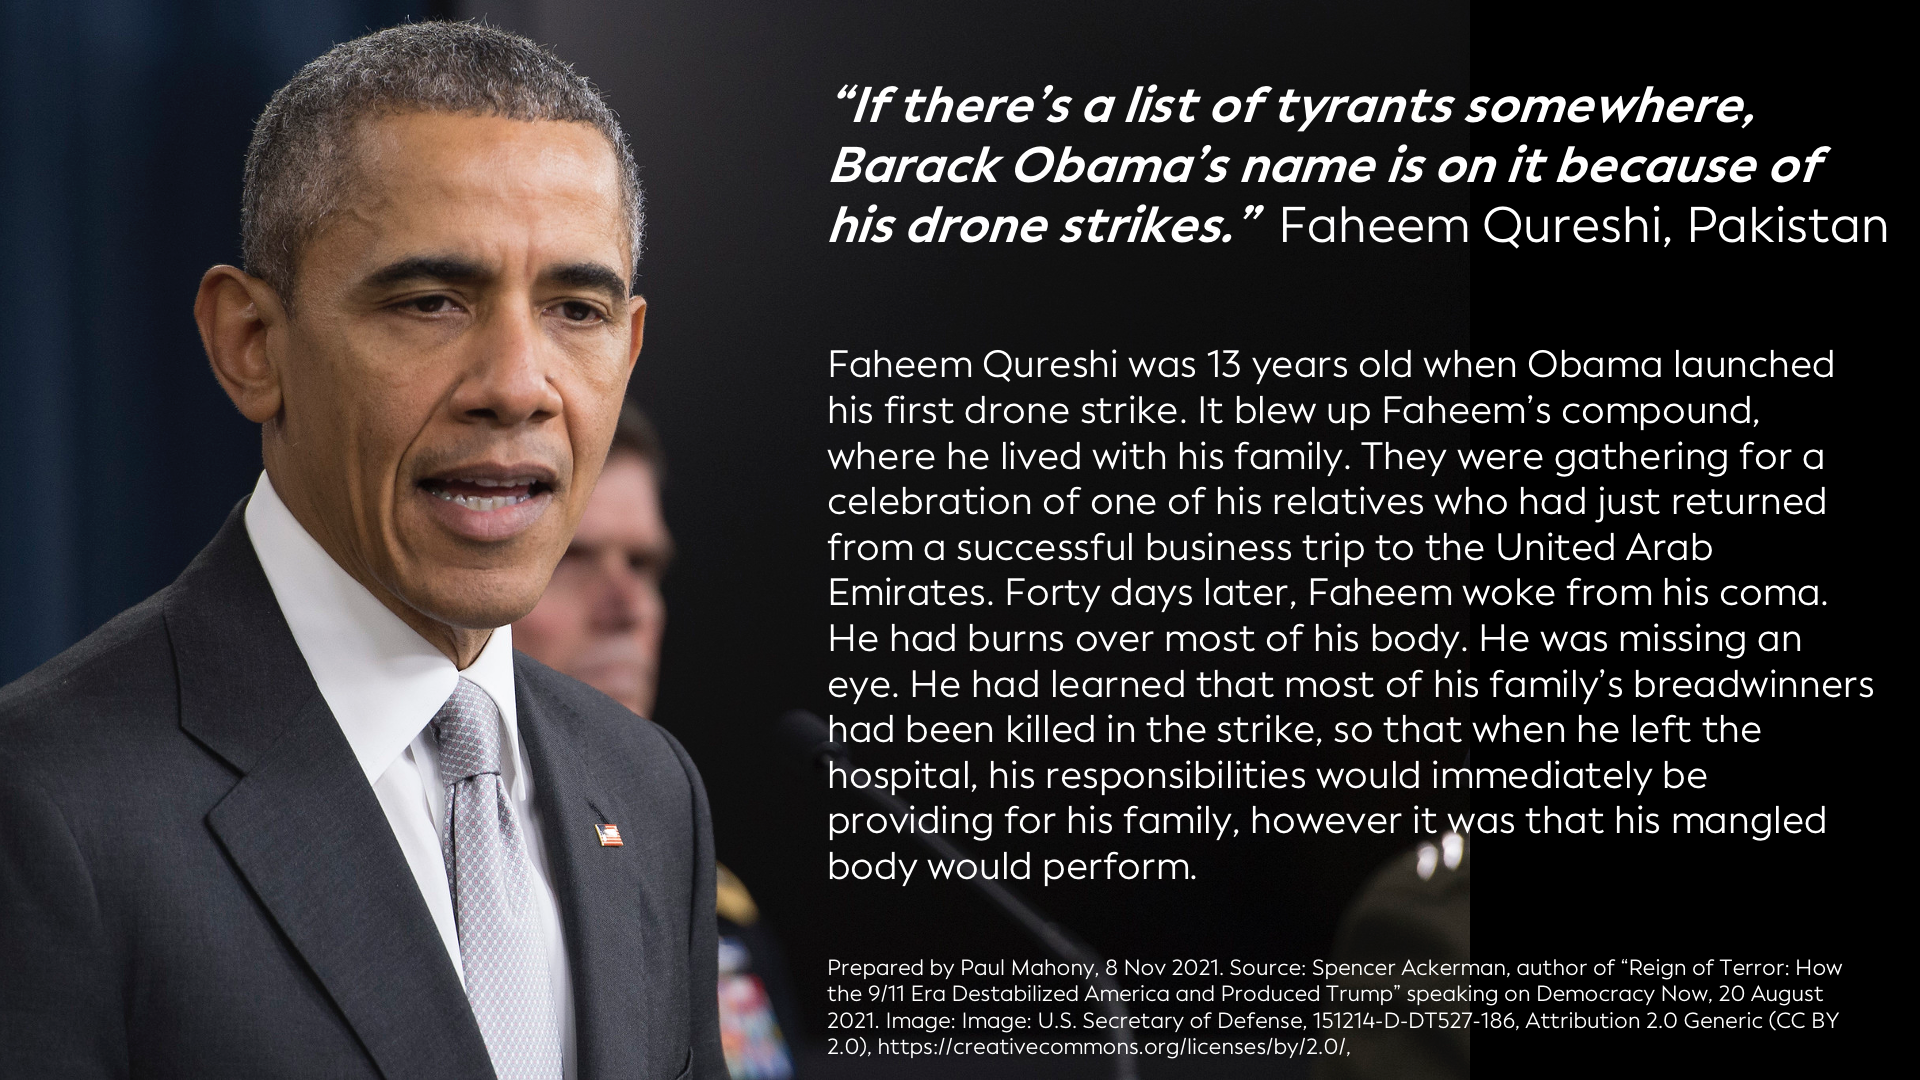
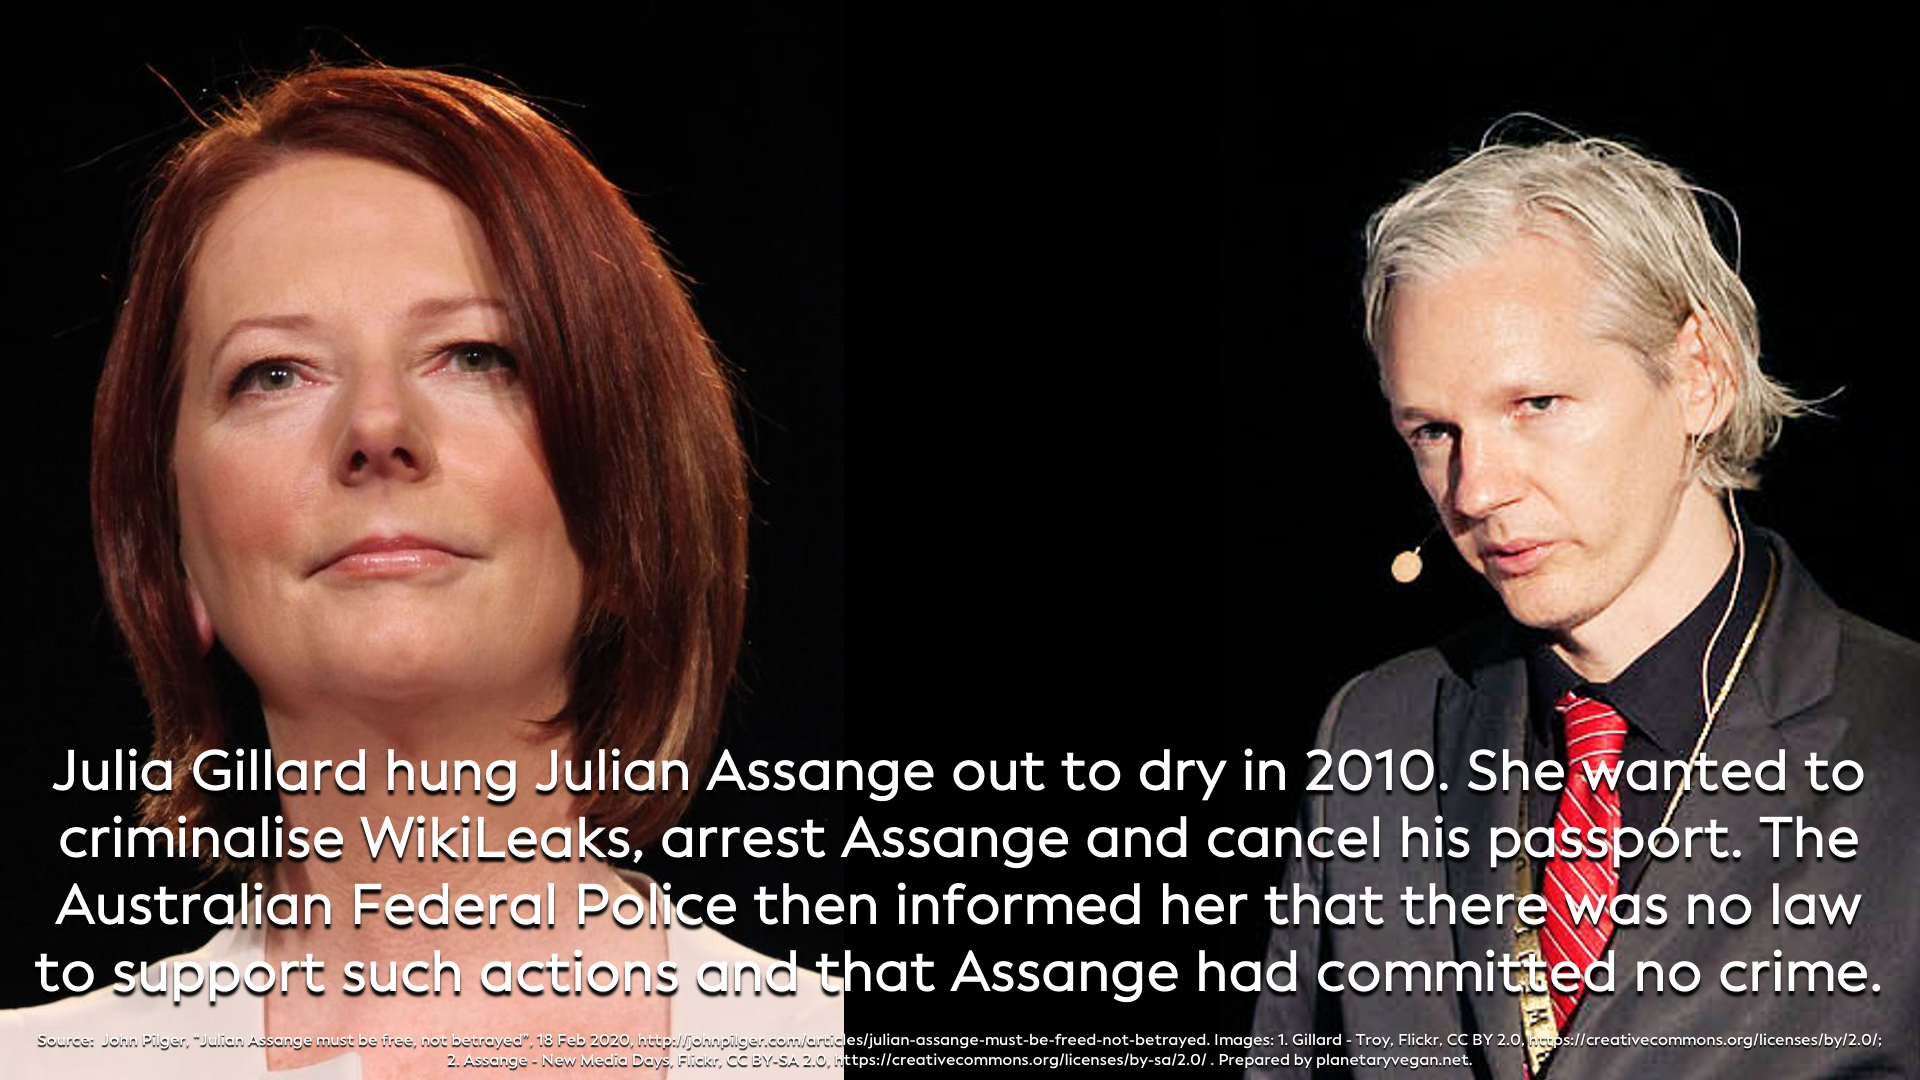
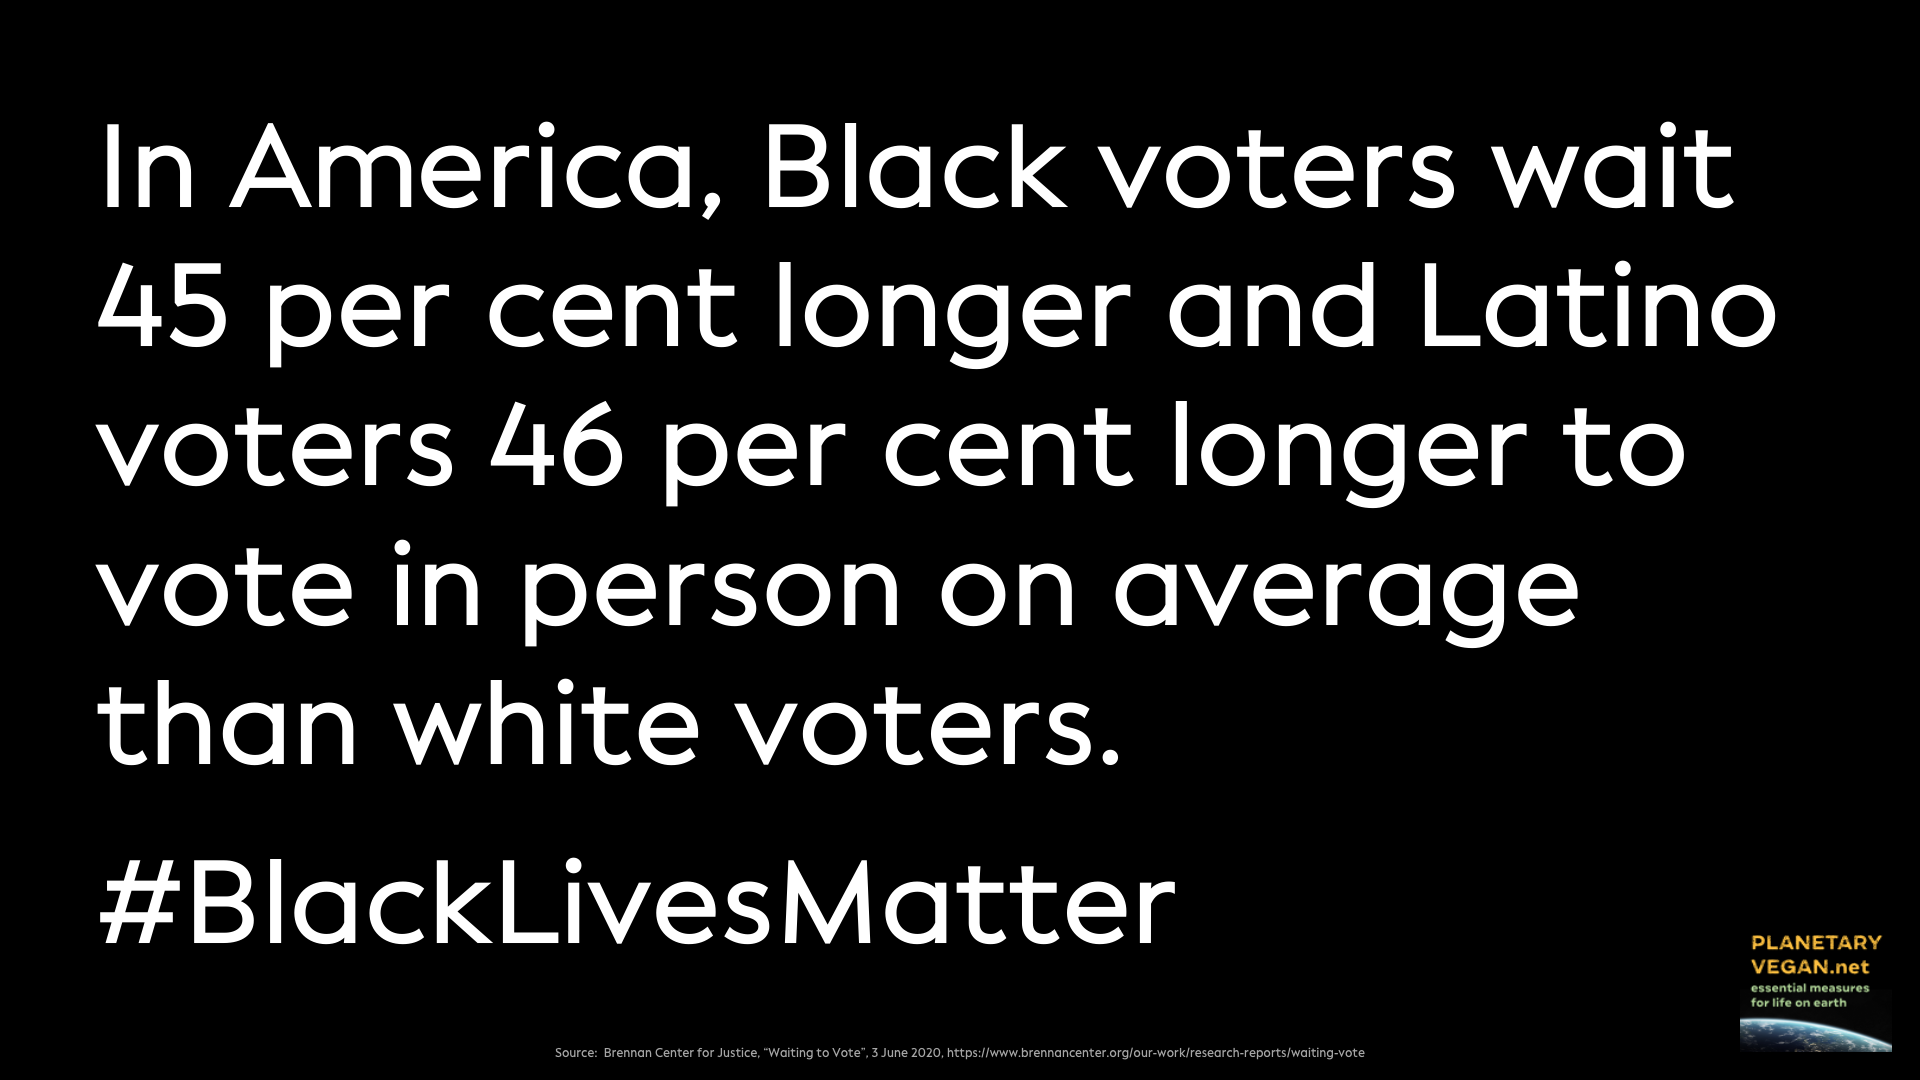
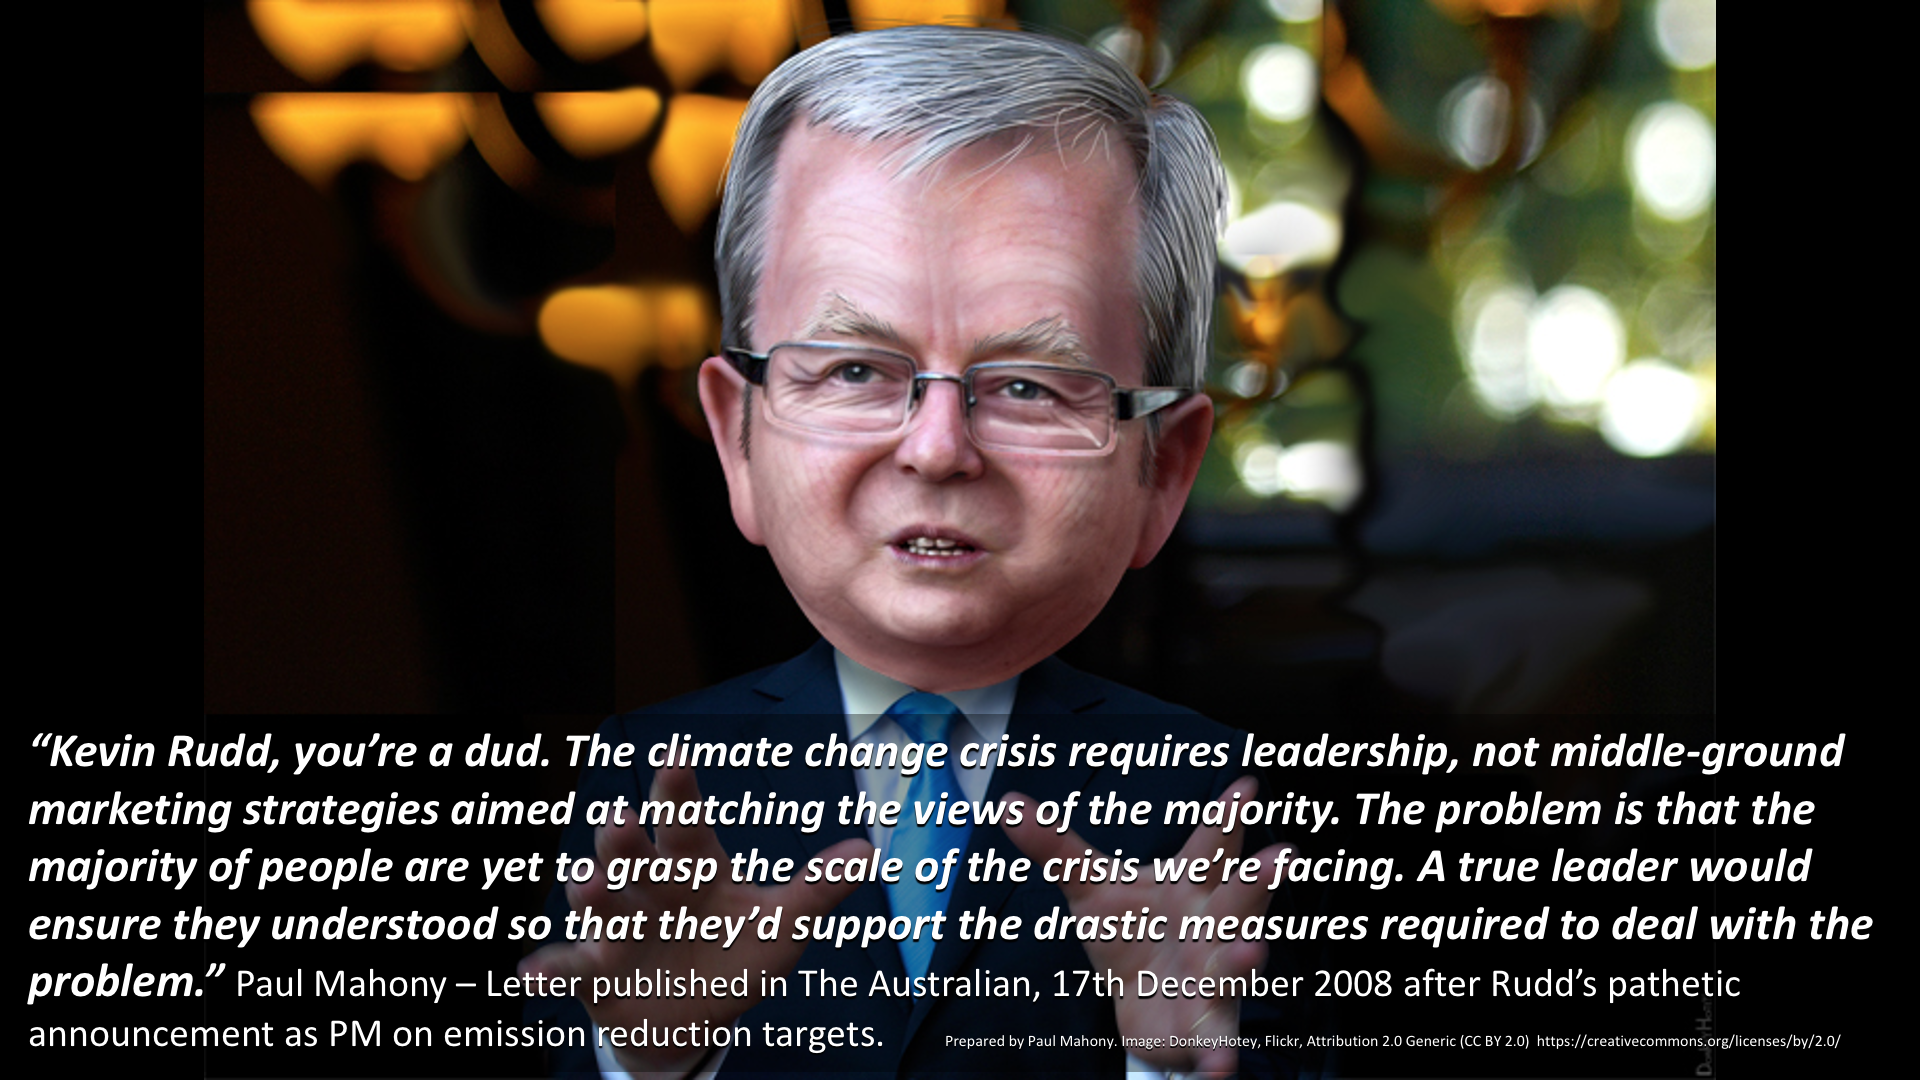
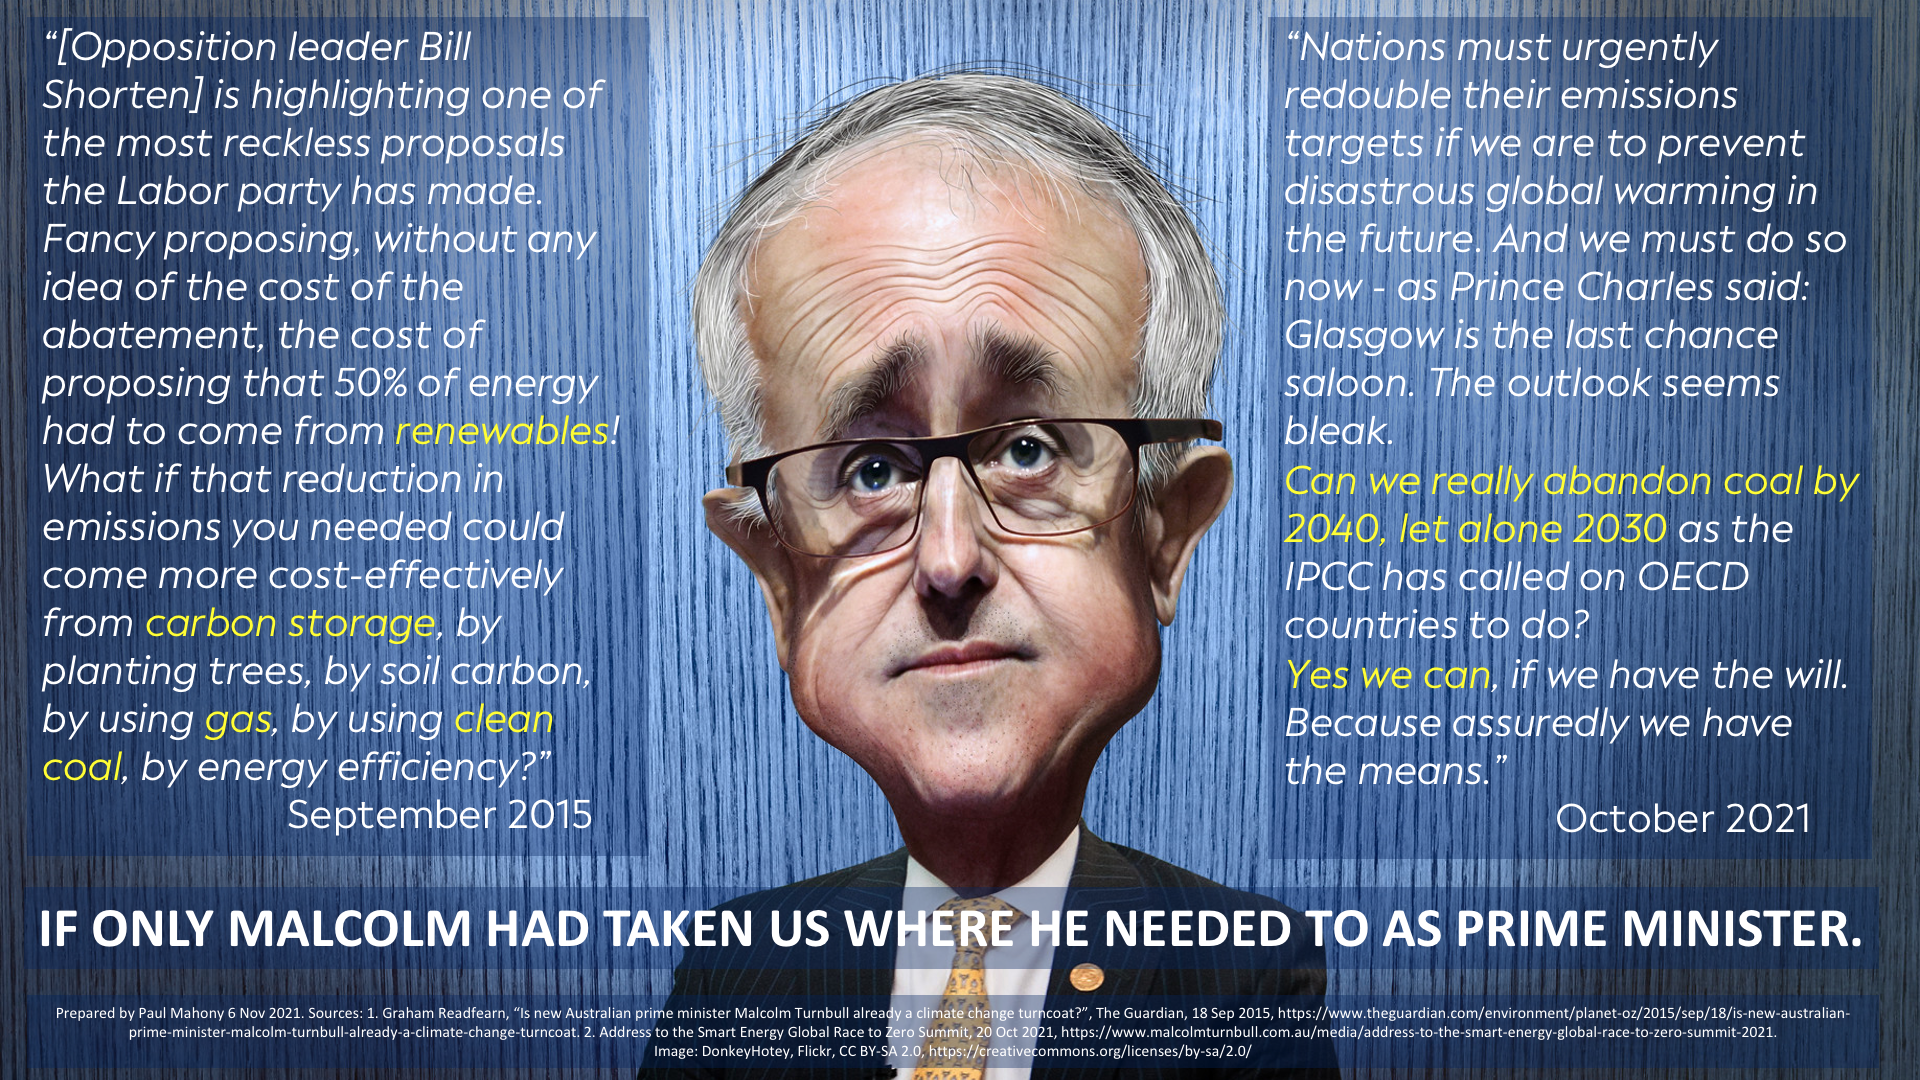
POLITICS AND SOCIAL JUSTICE


SOURCES OF NUTRITION

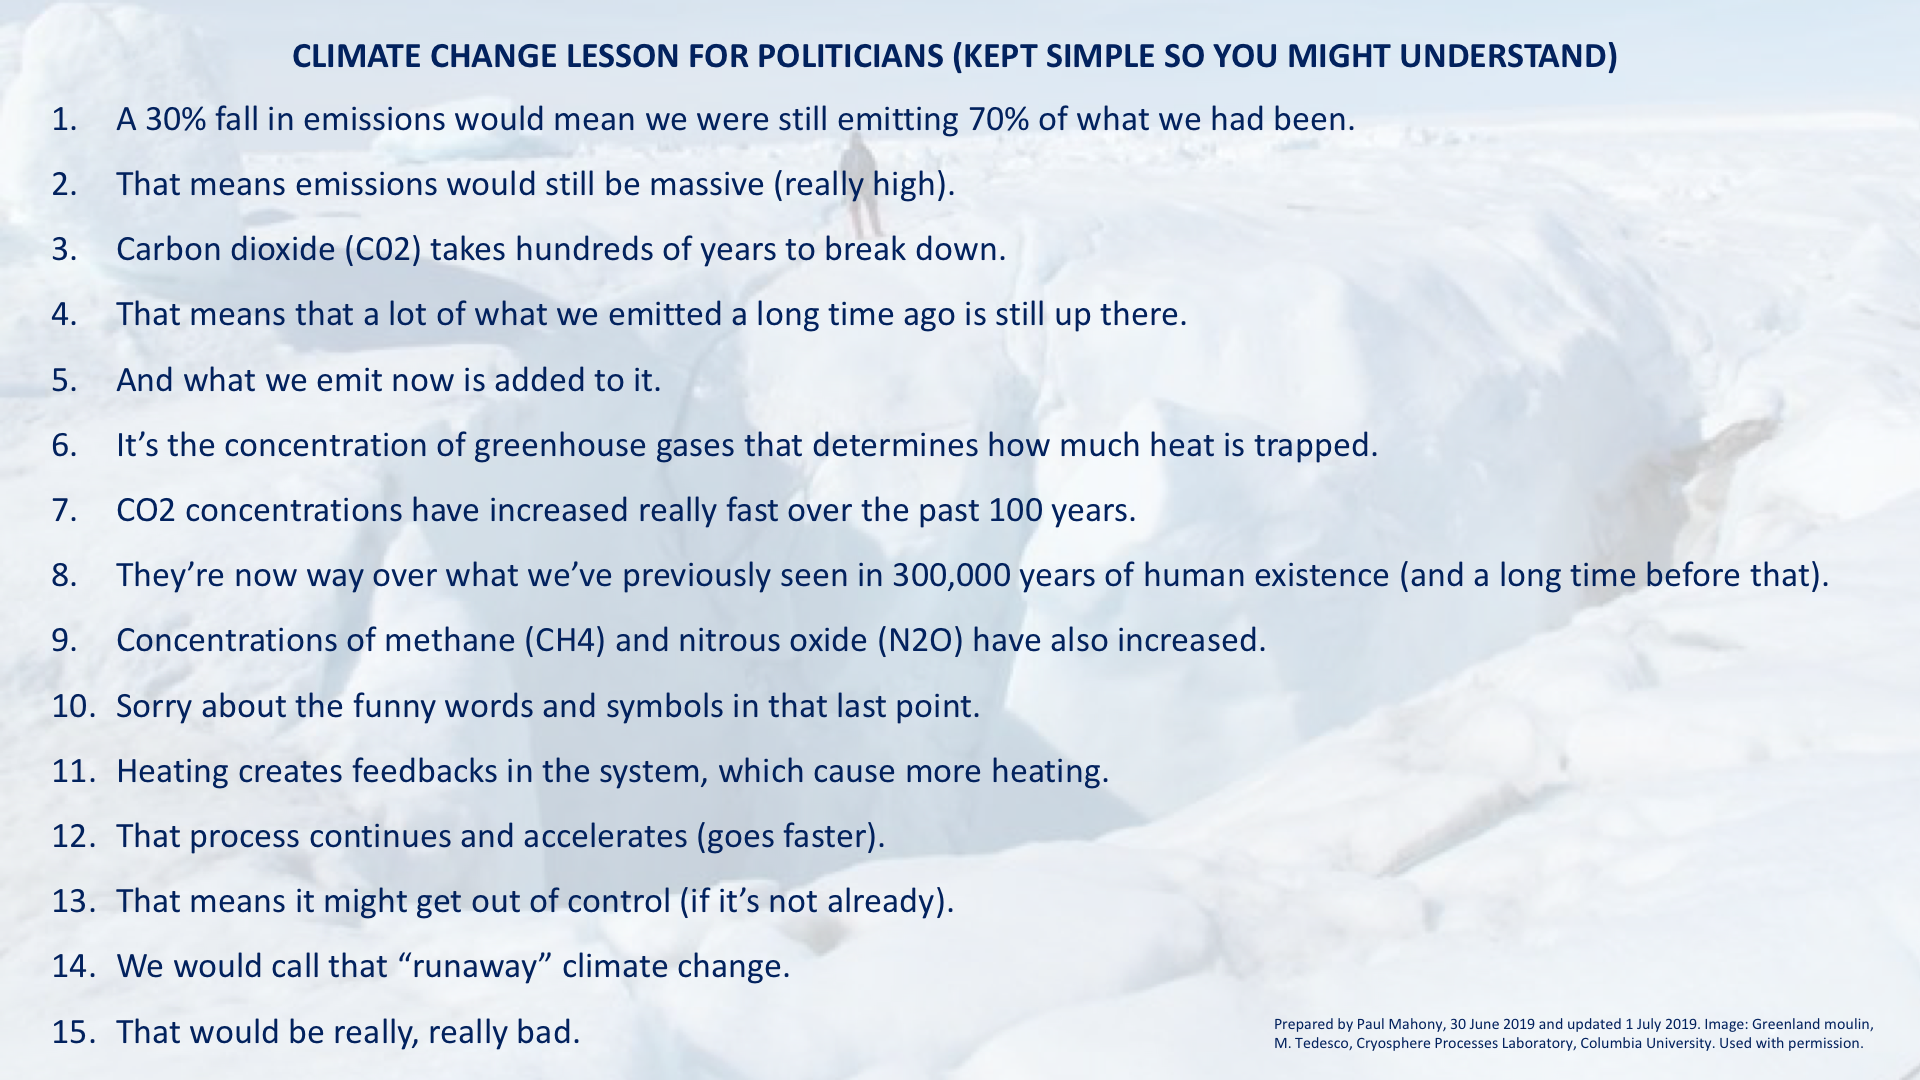
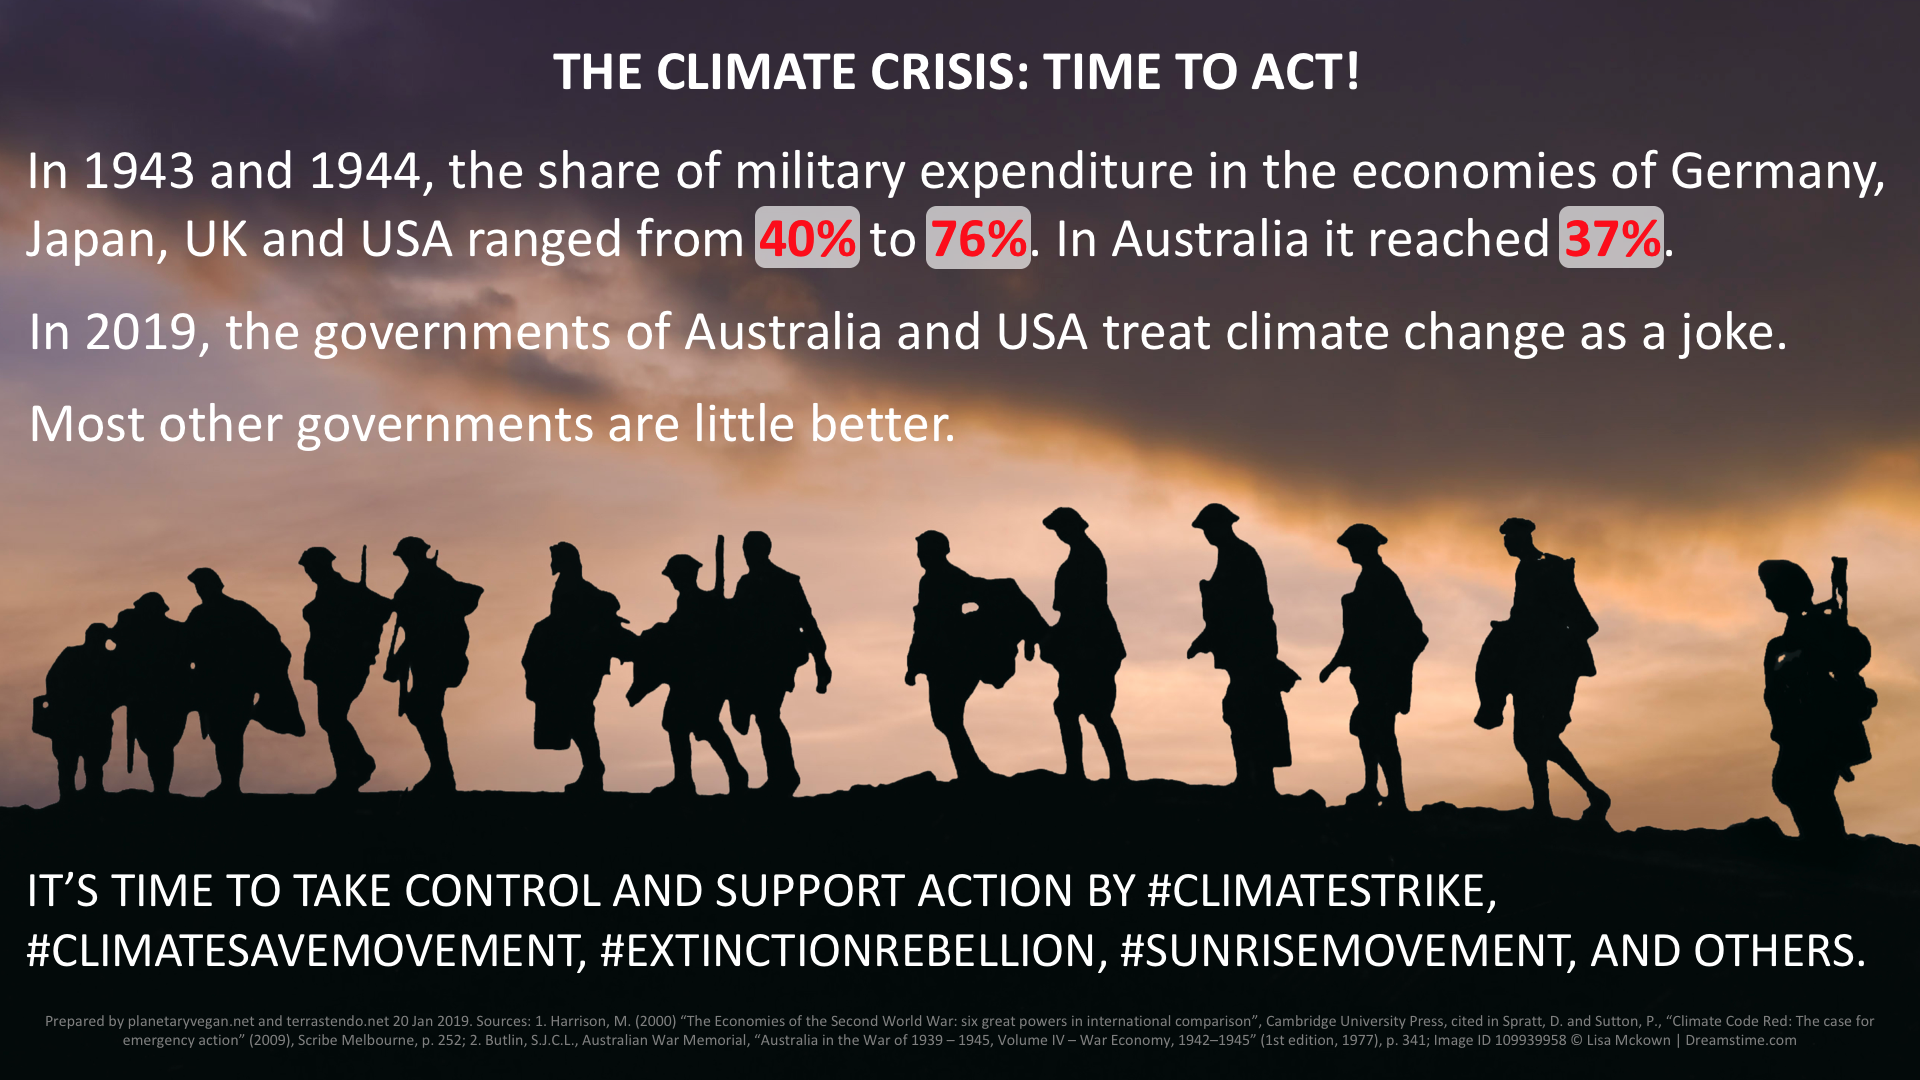
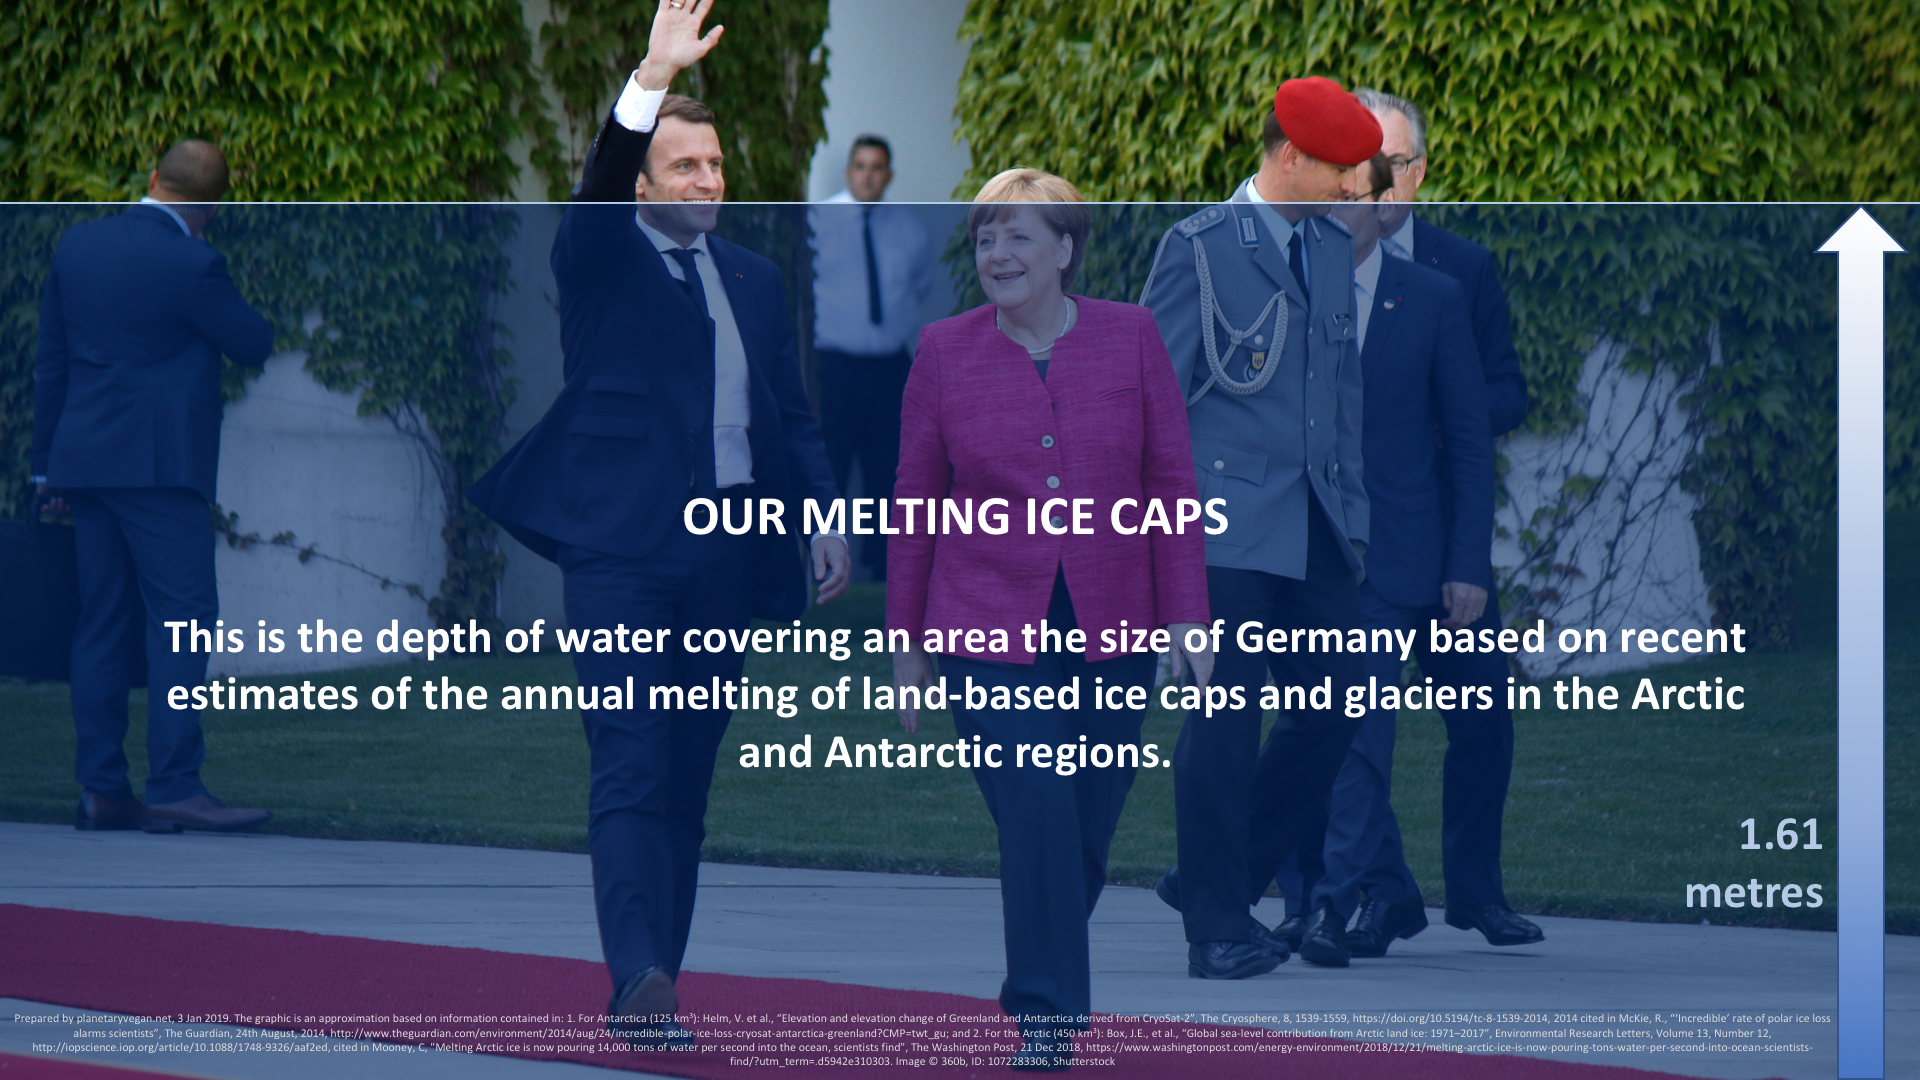
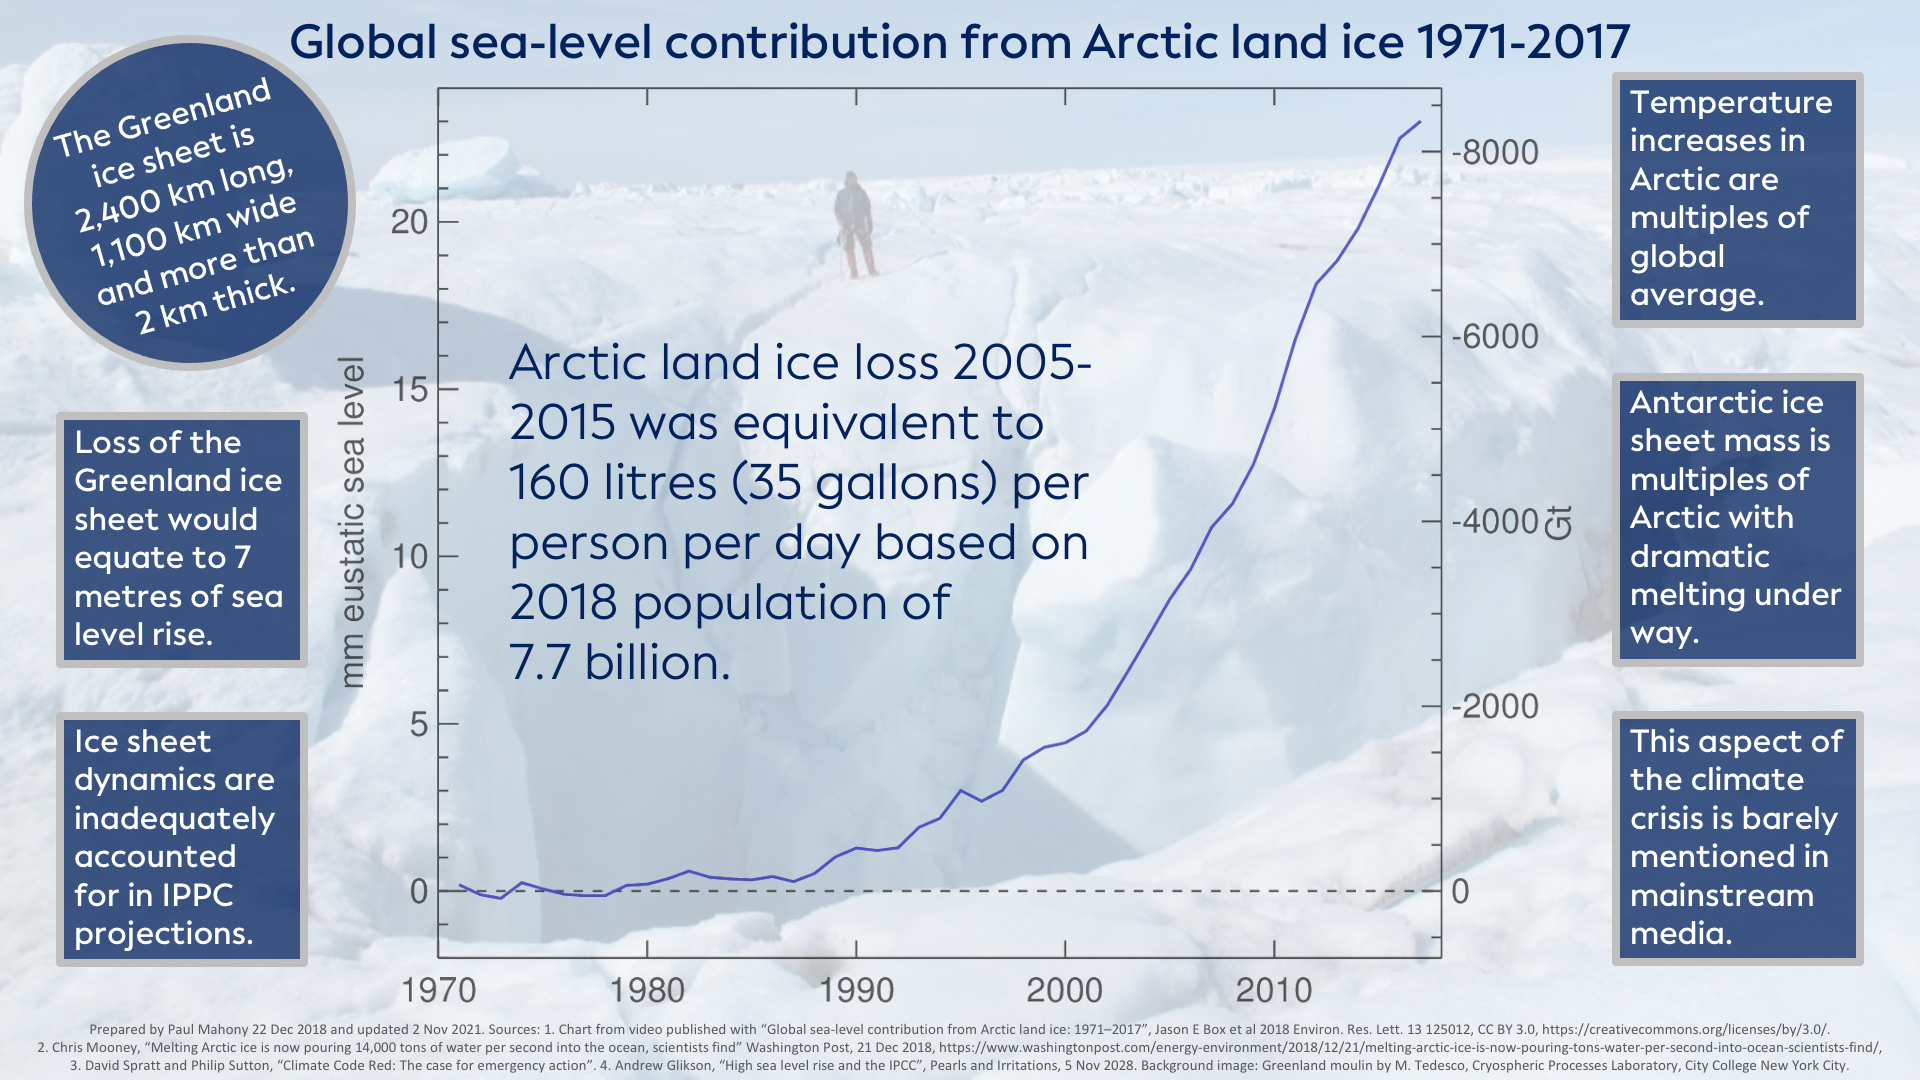
CLIMATE CHANGE IN GENERAL


The following two images are from the video presentation “Is it crunch time for the climate?”


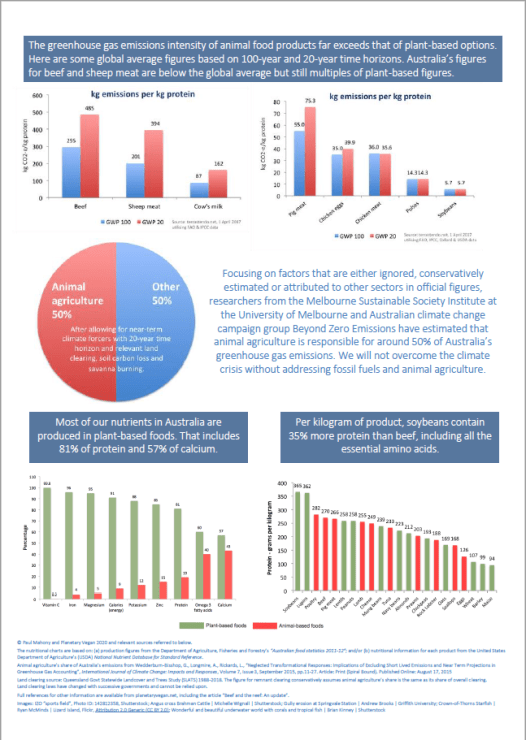
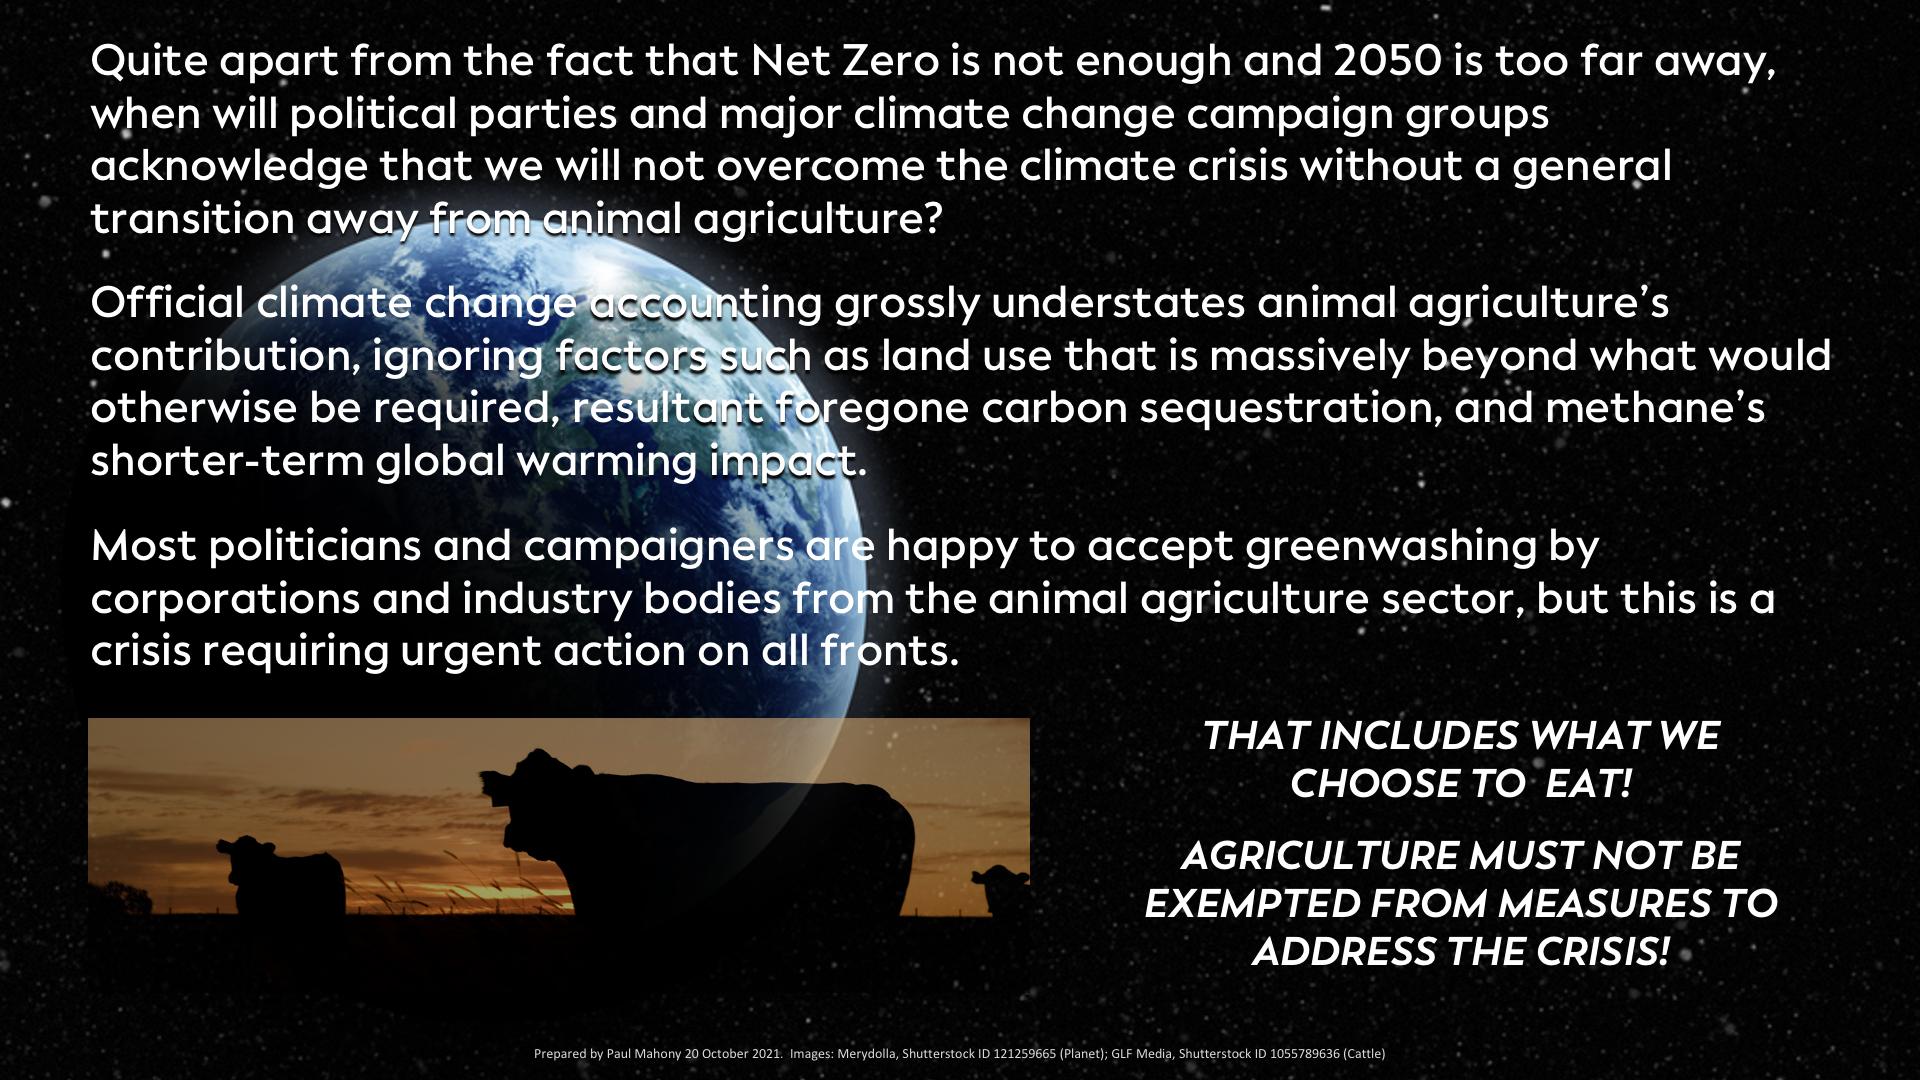
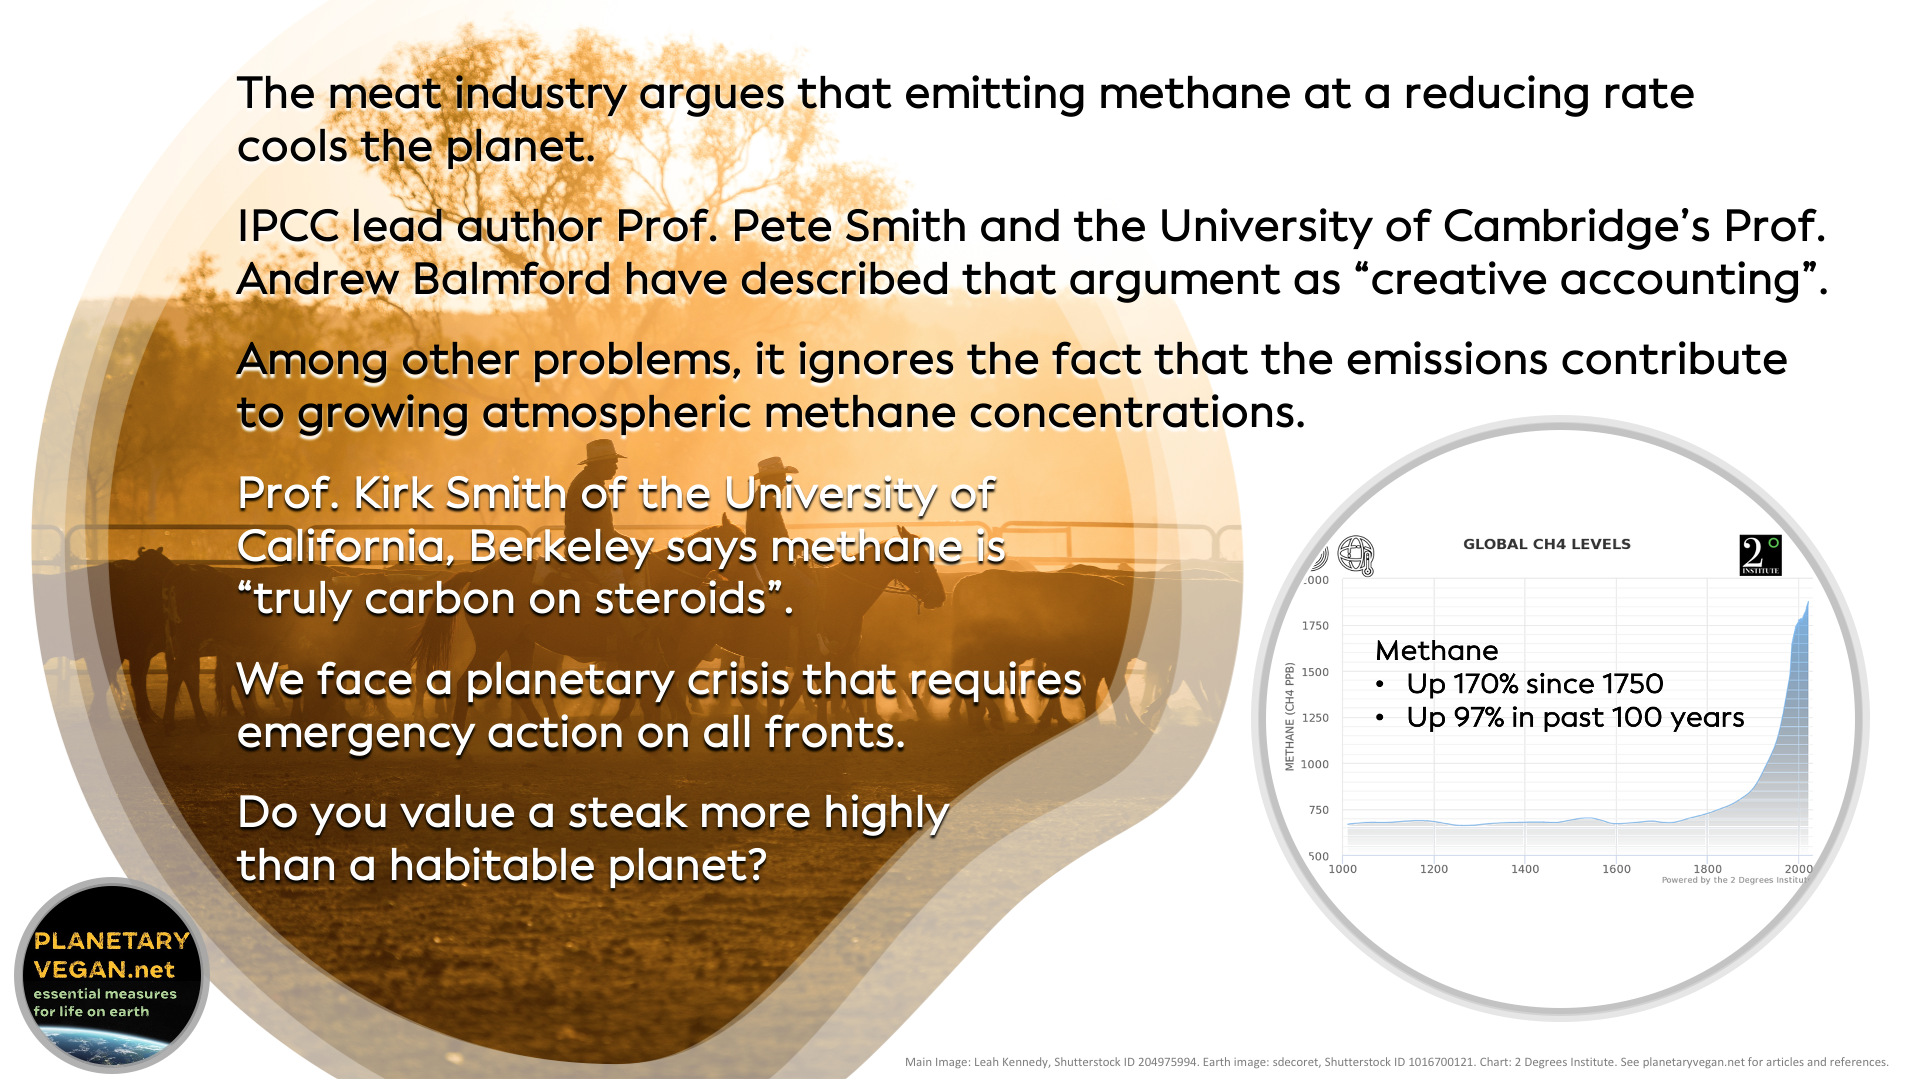
CLIMATE CHANGE AND ANIMAL AGRICULTURE


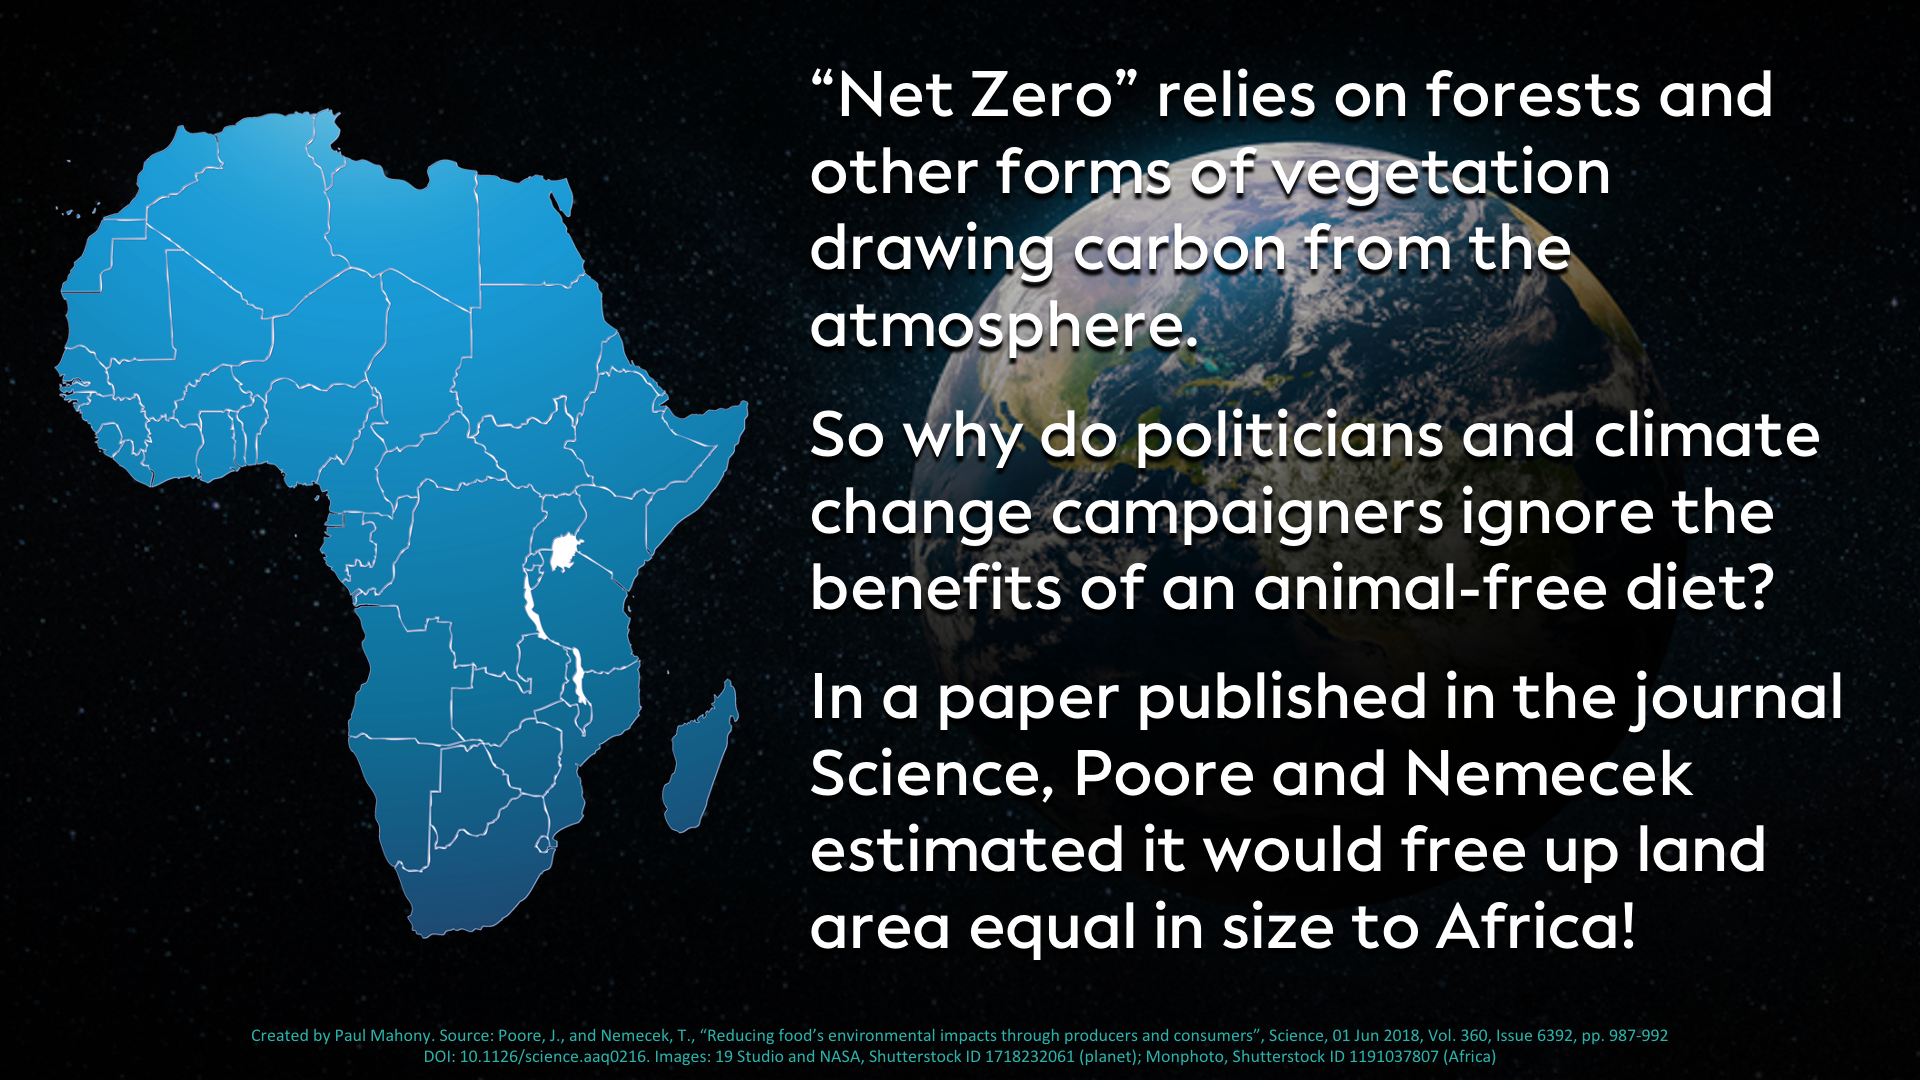
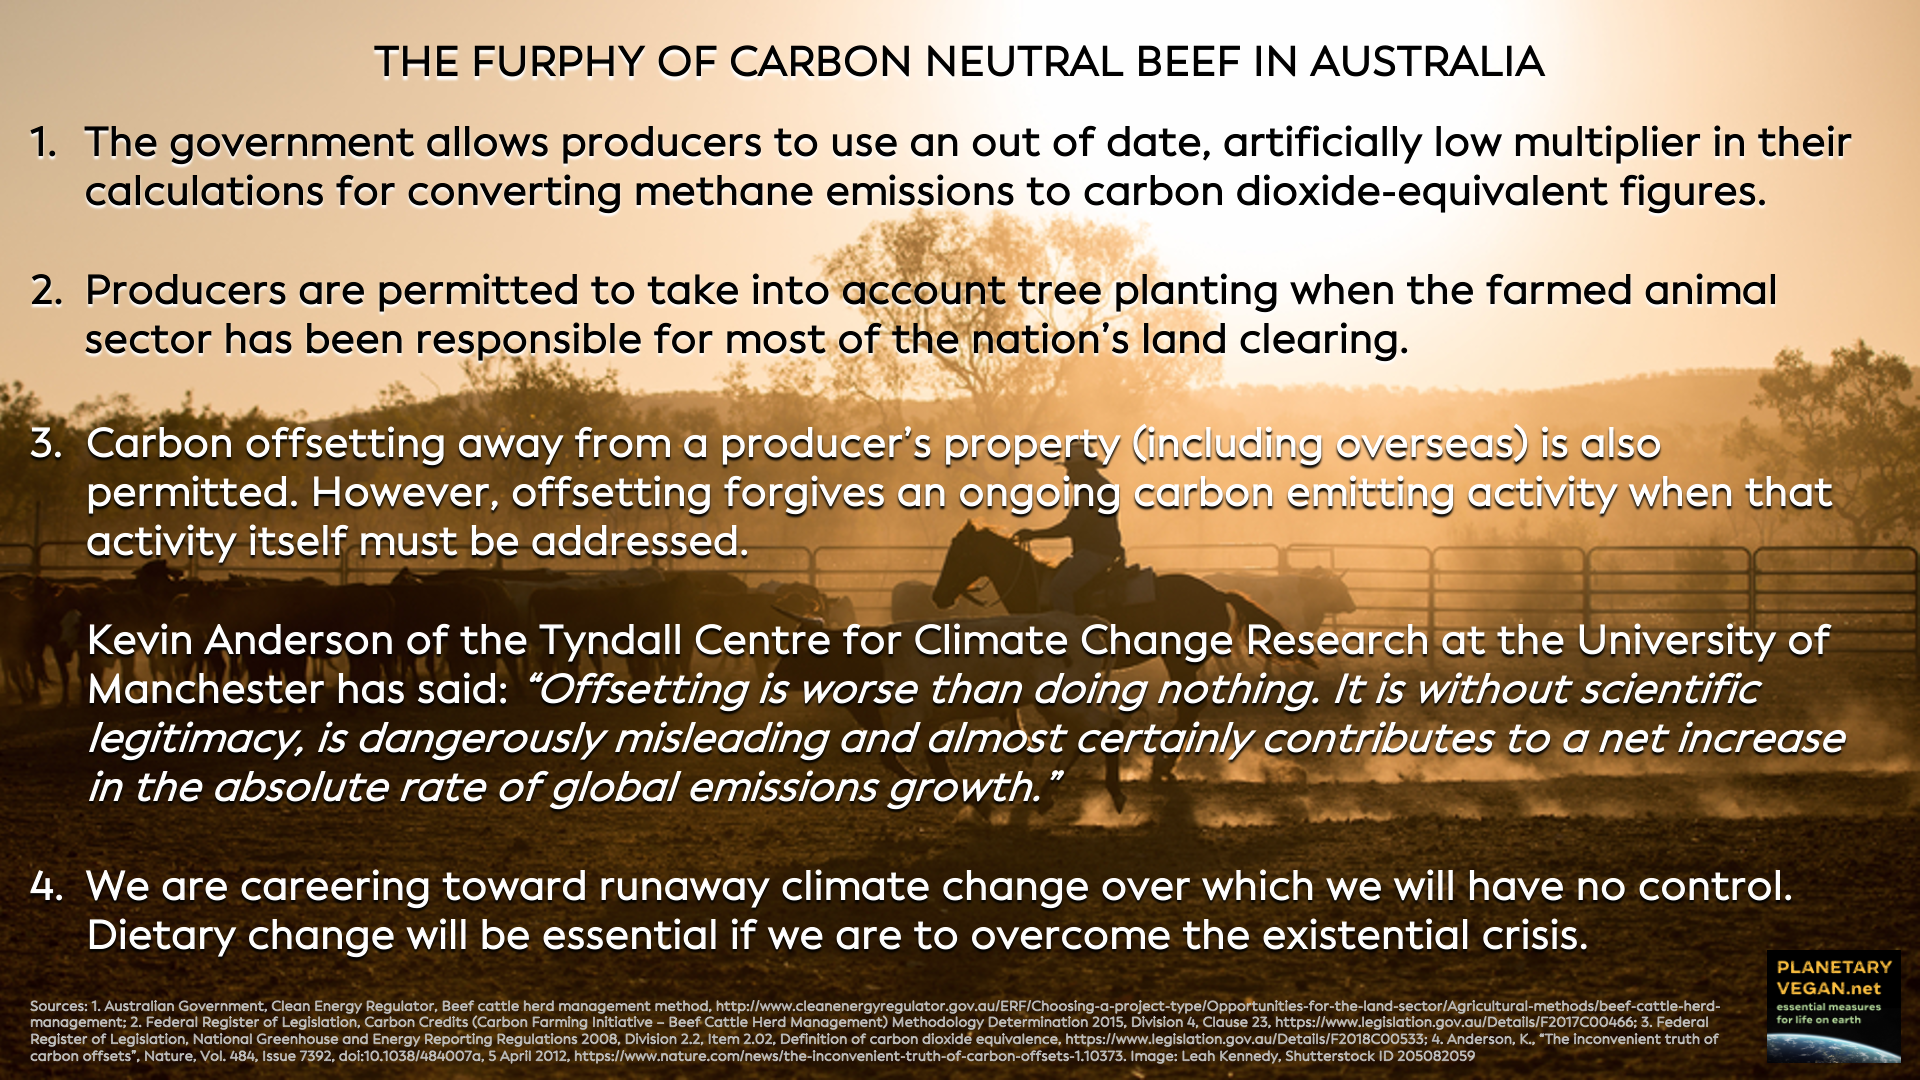
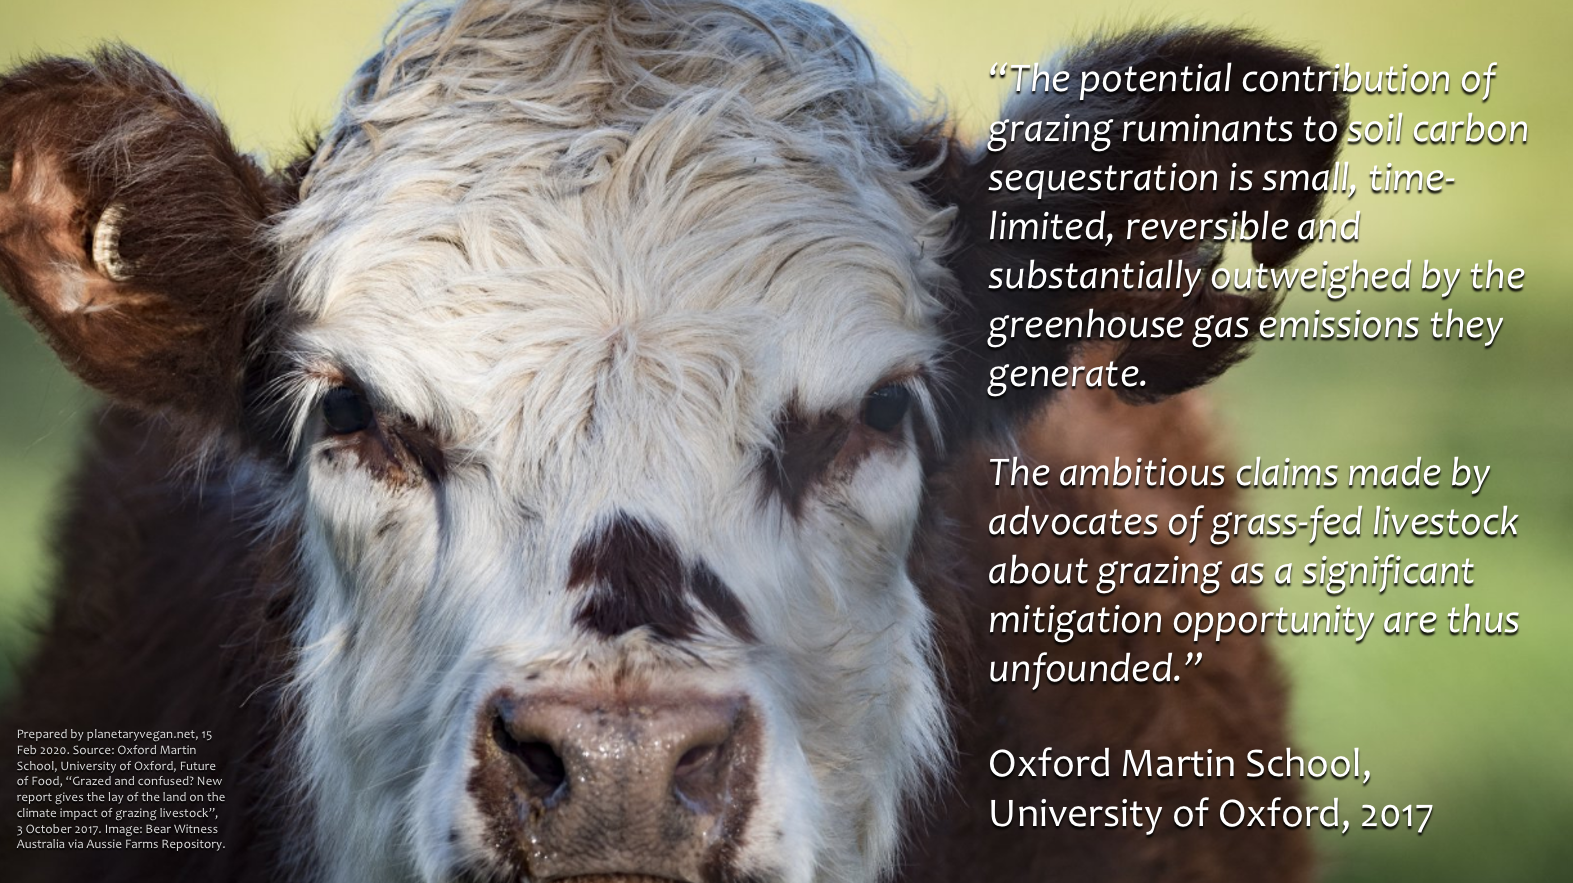
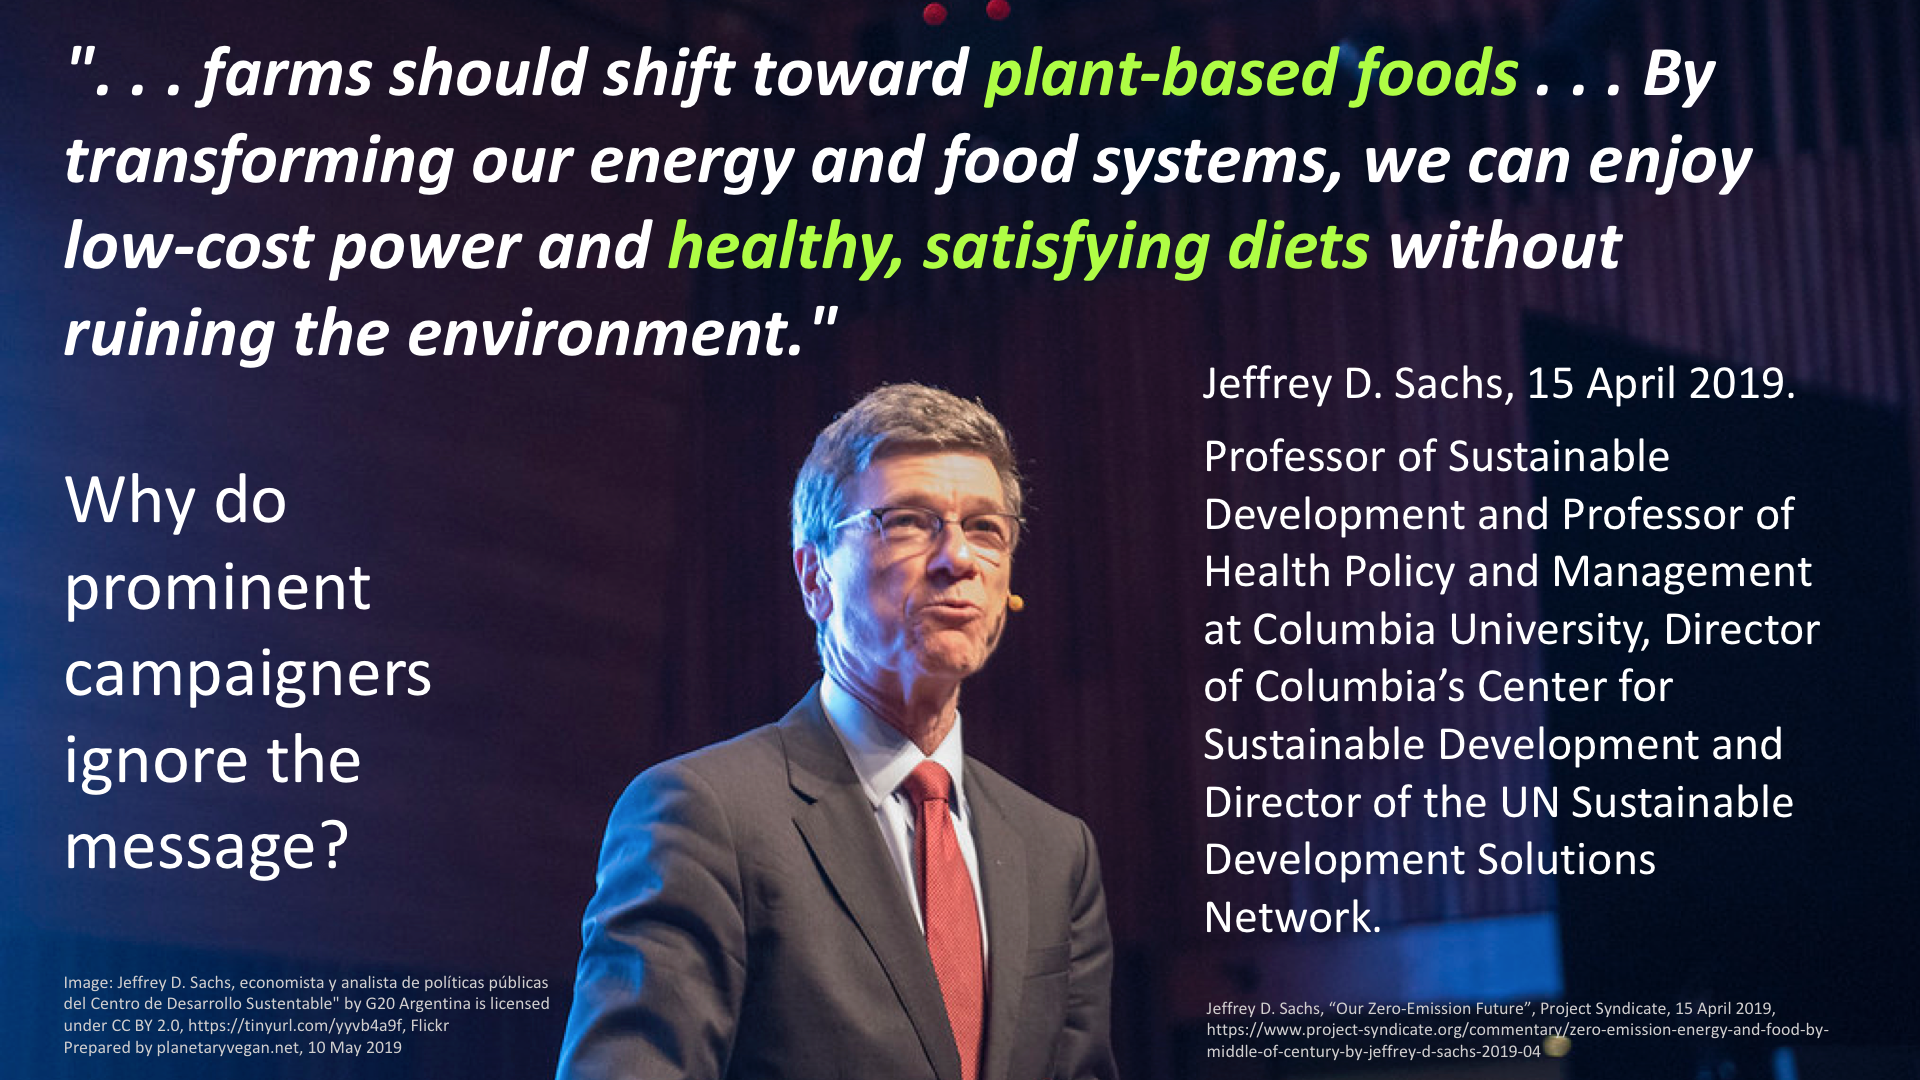
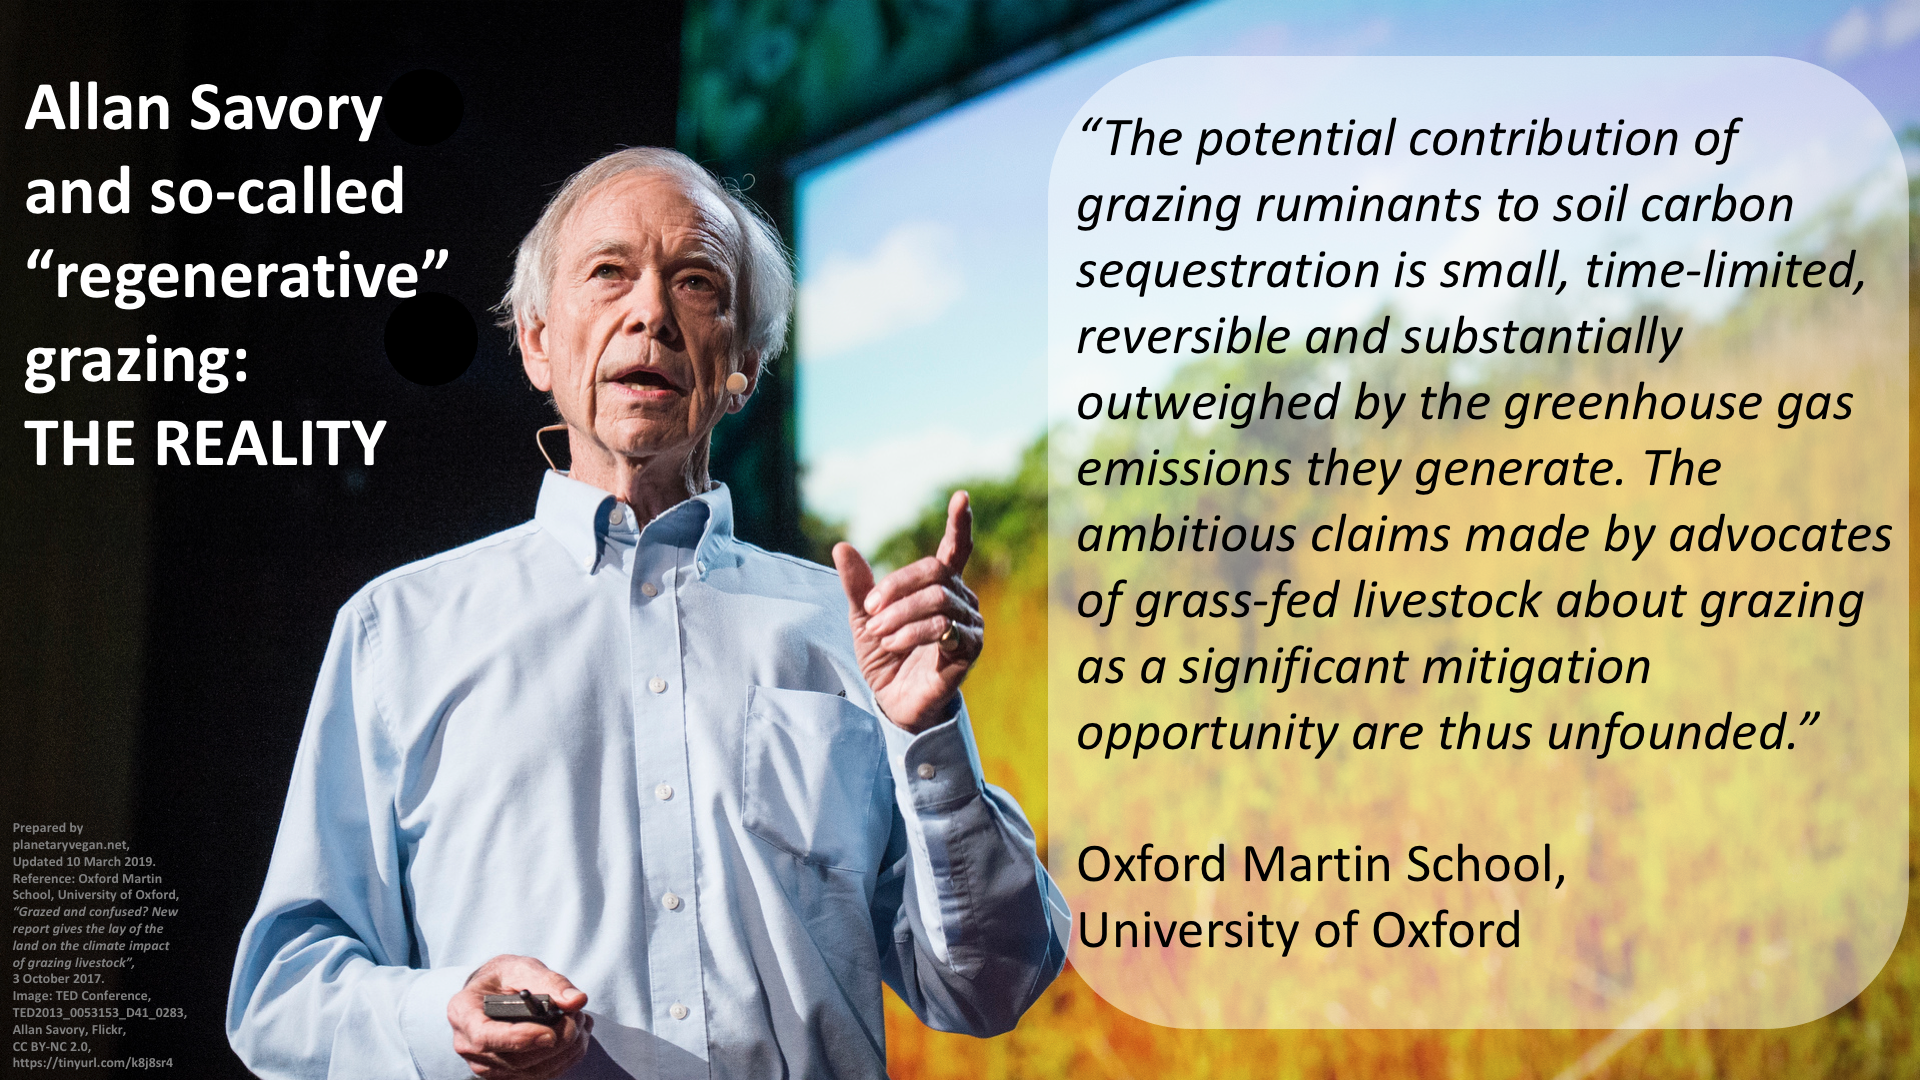
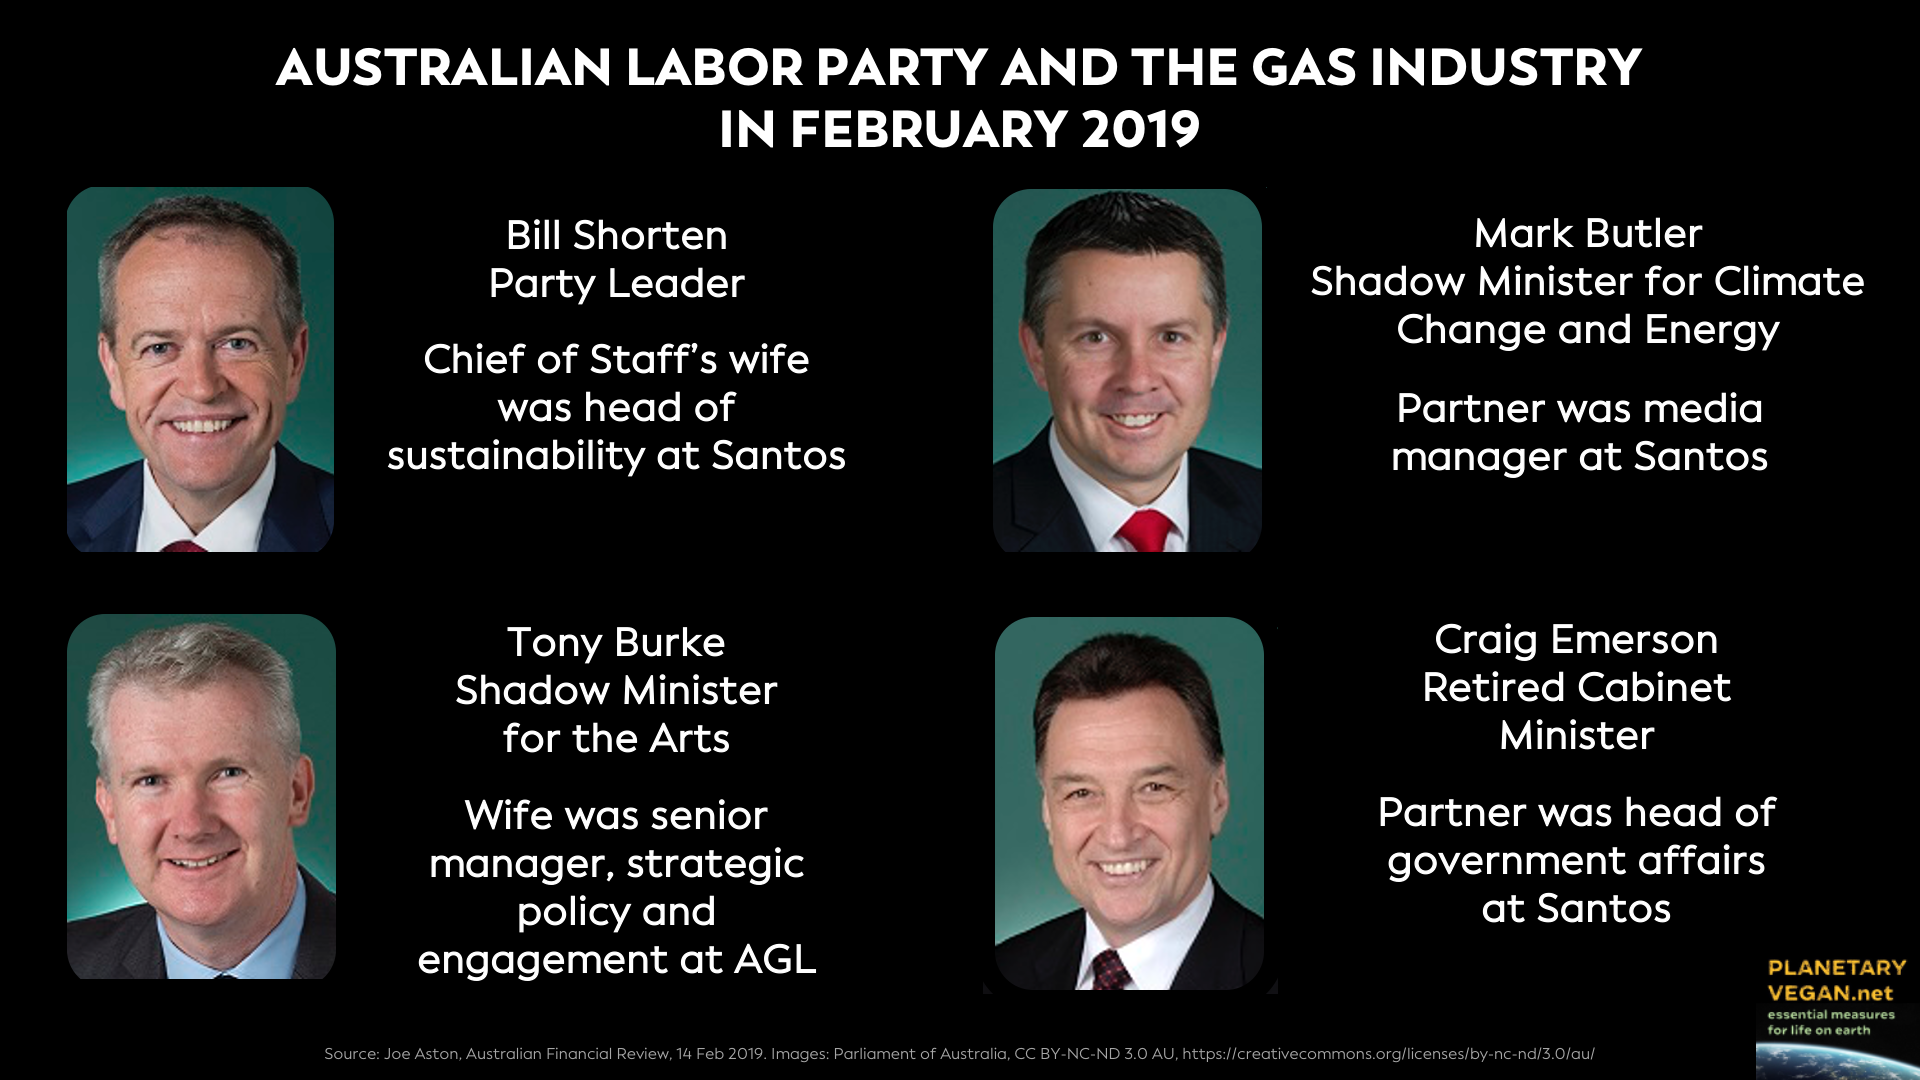
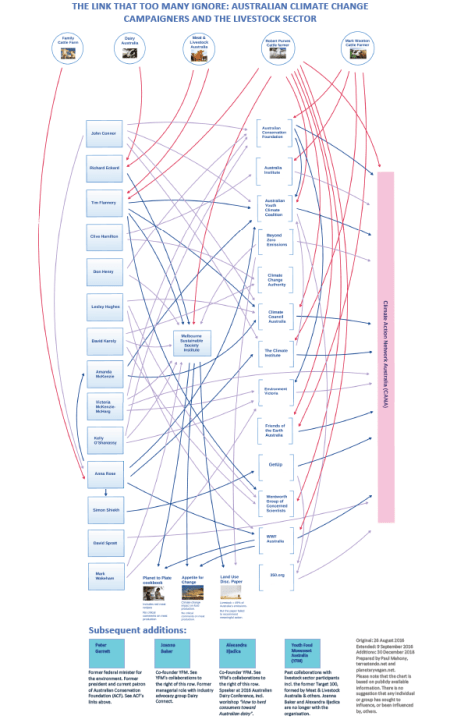
For more information on the following image, please visit “The link that too many ignore“, regarding links between Australian climate change campaigners and the livestock sector.


Emissions intensity (kg CO2-e/kg protein) for beef, sheep meat and cow’s milk:

Emissions intensity (kg CO2-e/kg protein) for other products:

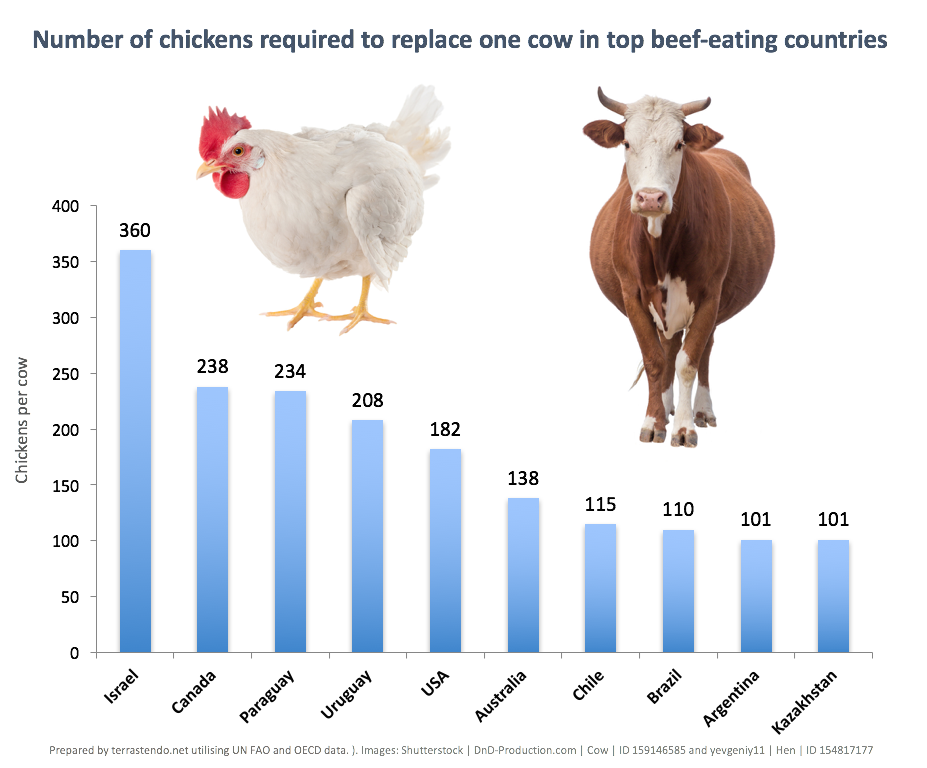
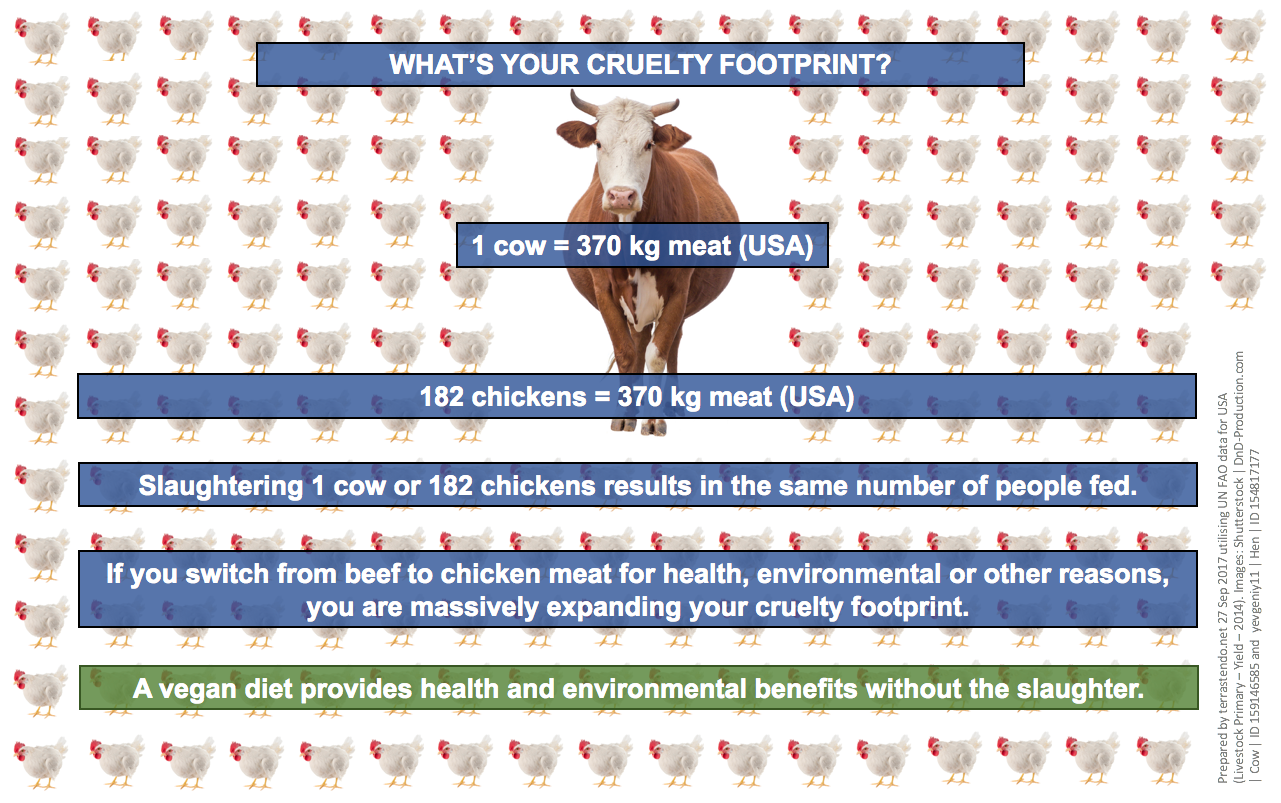
WHAT’S YOUR CRUELTY FOOTPRINT?
If you replace beef and lamb with chicken in order to reduce your carbon footprint, then you are massively increasing your cruelty footprint. This chart shows the number of chickens required to replace one cow in the top per capita beef-eating countries:

POPULATION

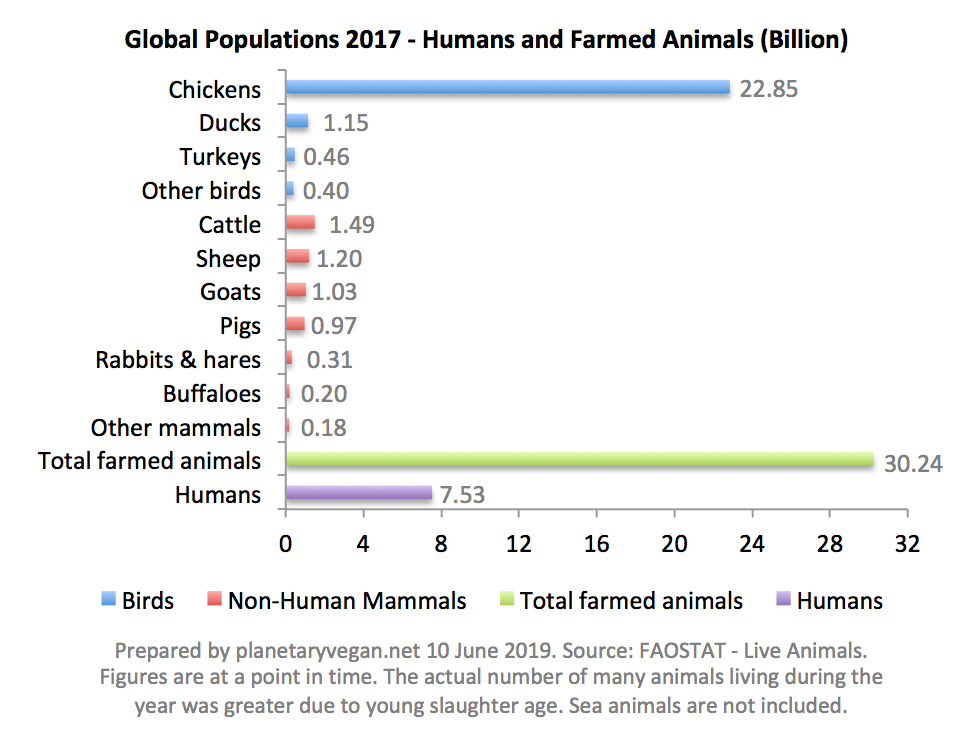
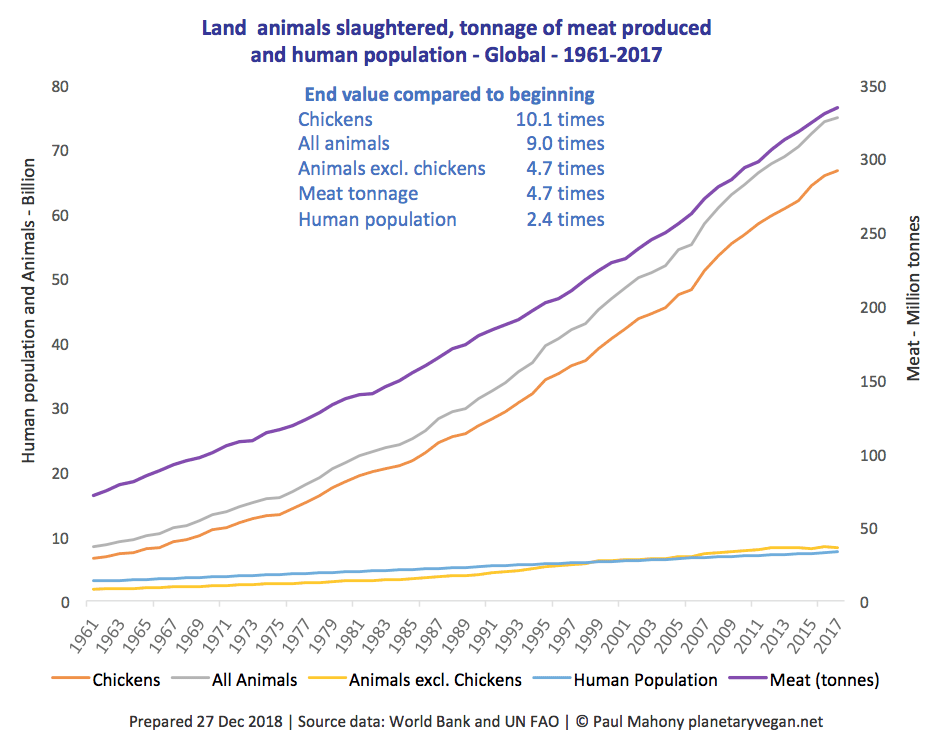
SLAUGHTER NUMBERS
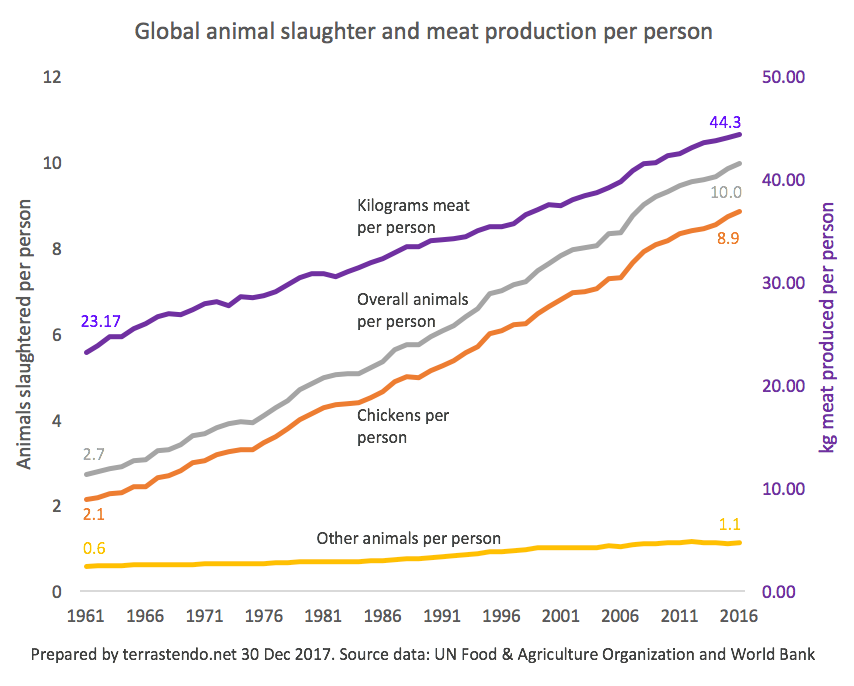
World

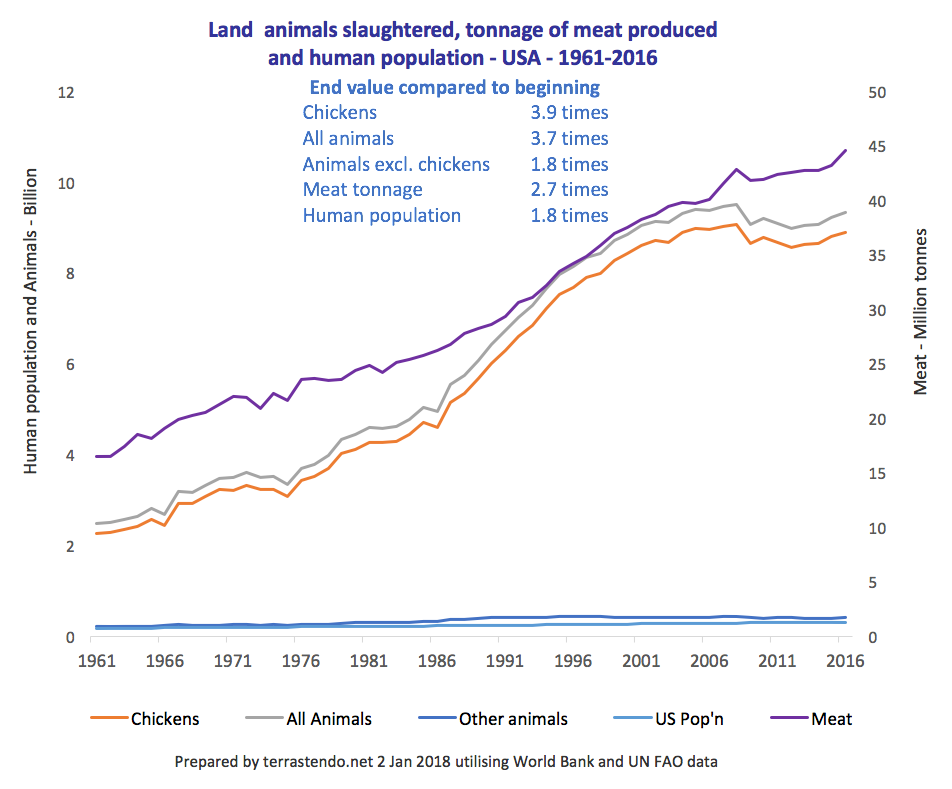
USA


China


UK


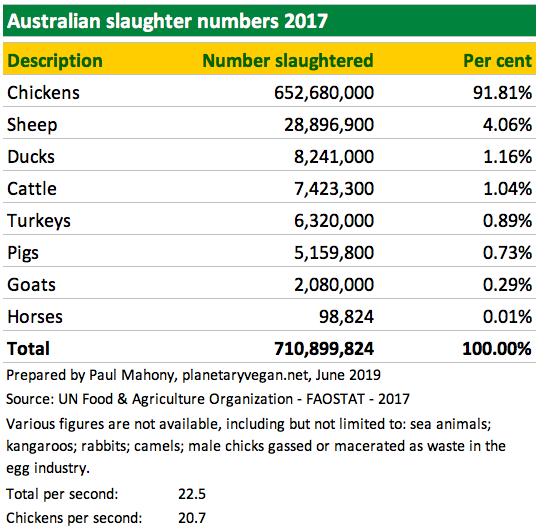
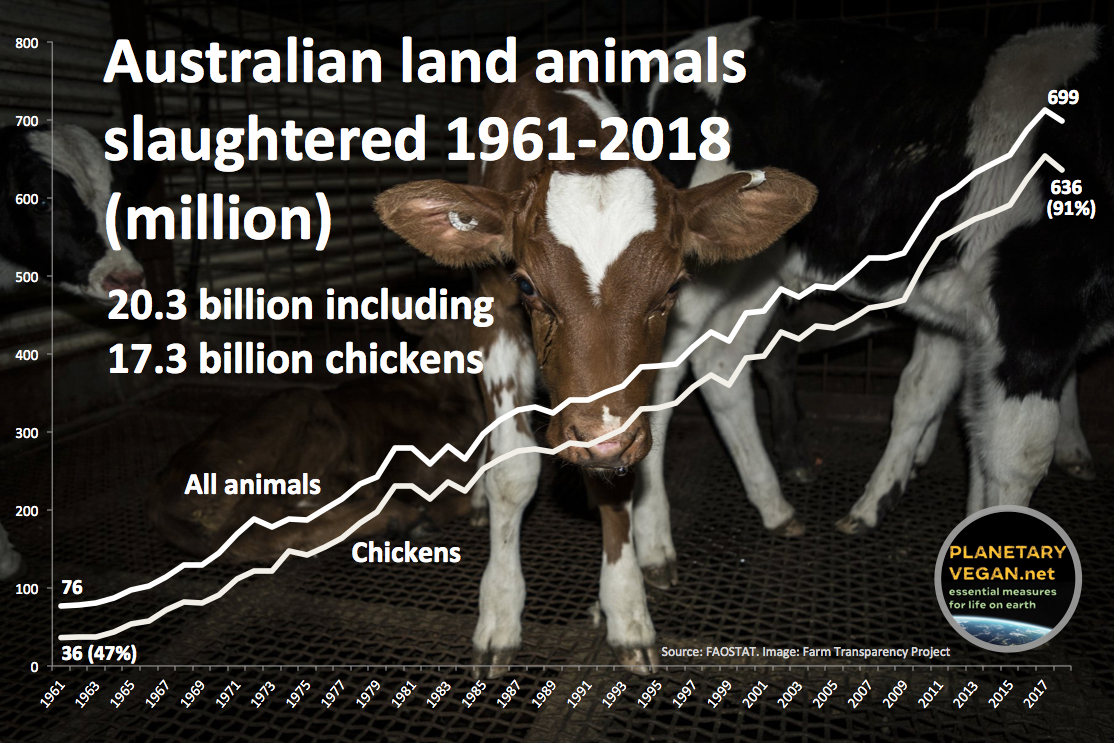
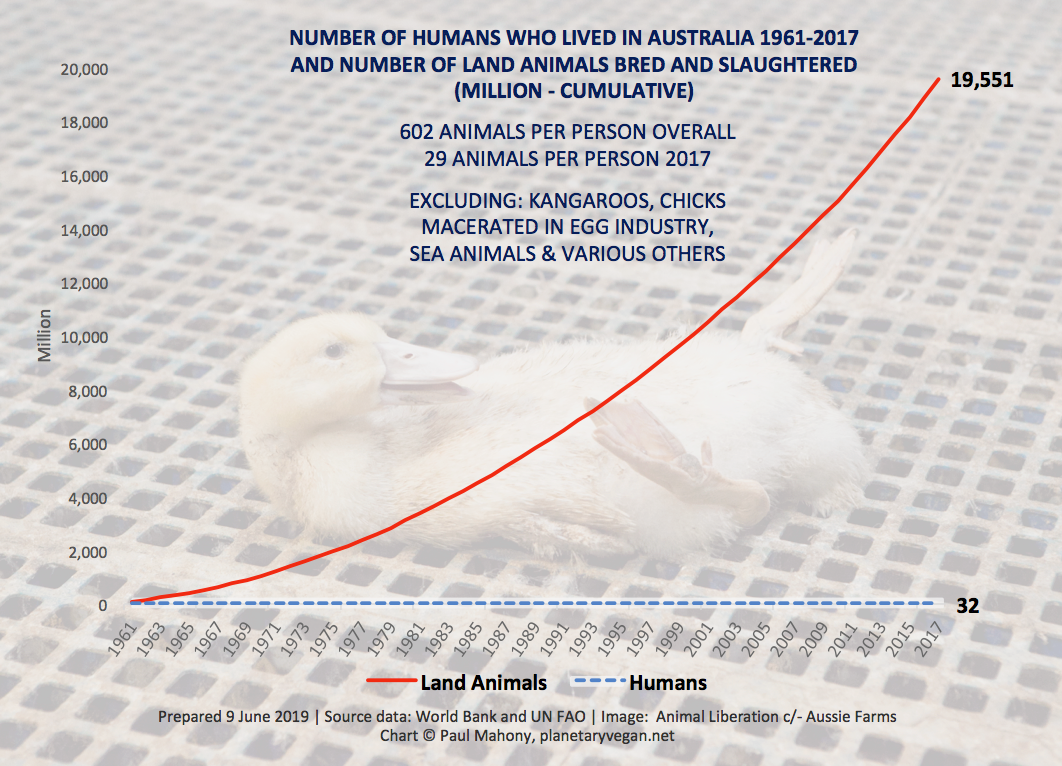
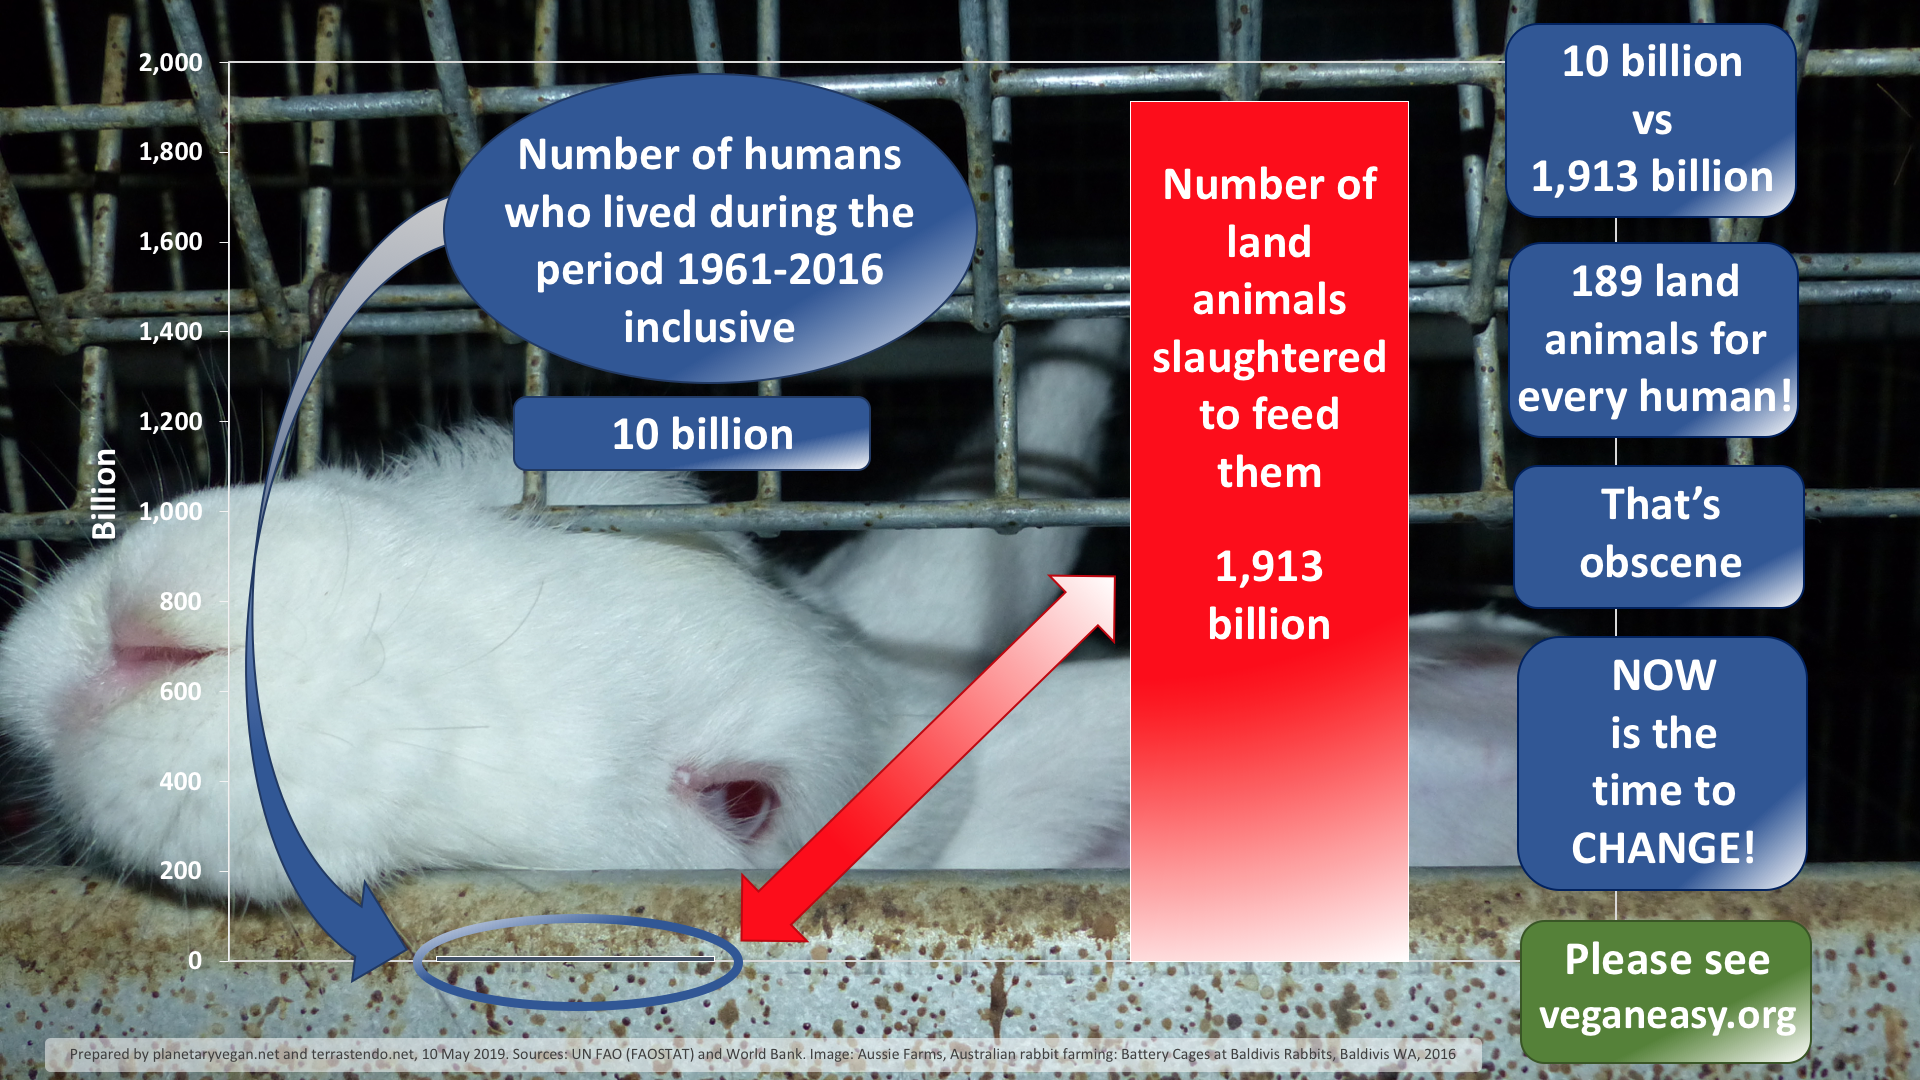
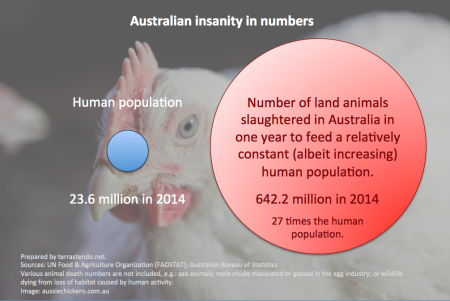
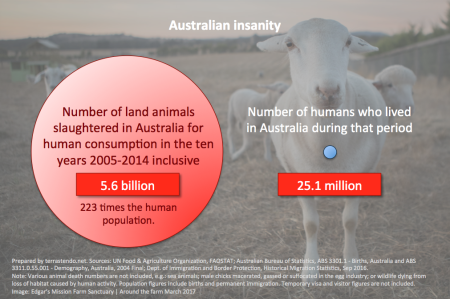
Australia


Canada


New Zealand


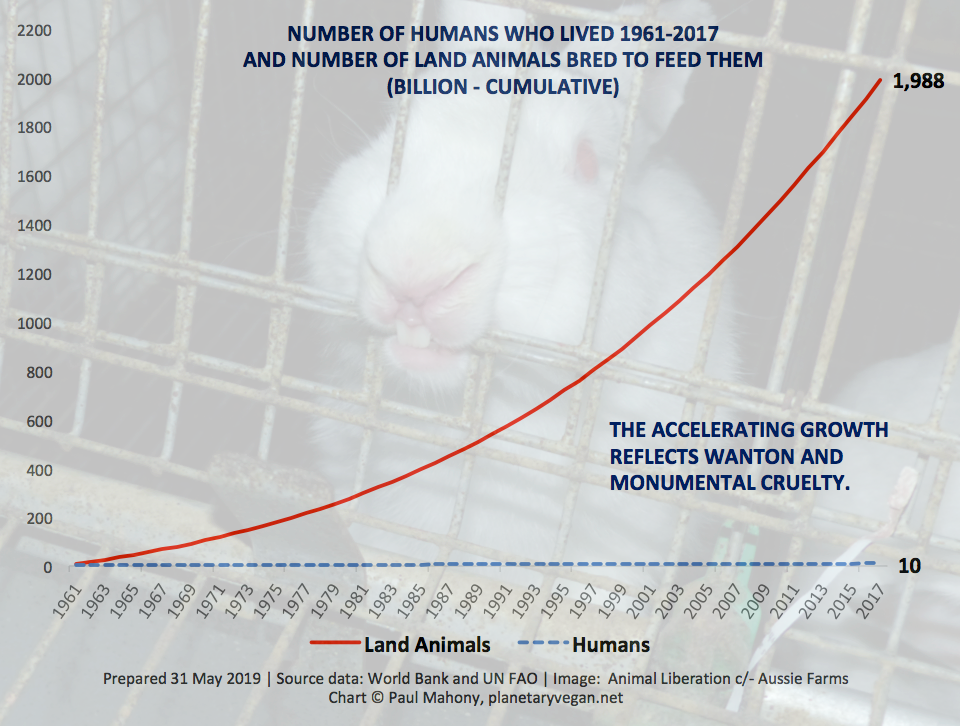
The shocking and shameful figures in the next image reflect the full period of animal slaughter statistics published by the UN Food & Agriculture Organization to 2016. As in all images in the “bubble” and bar chart series, each “number” contributing to the slaughter total represents a thinking and feeling individual, able to experience physical and psychological pain.

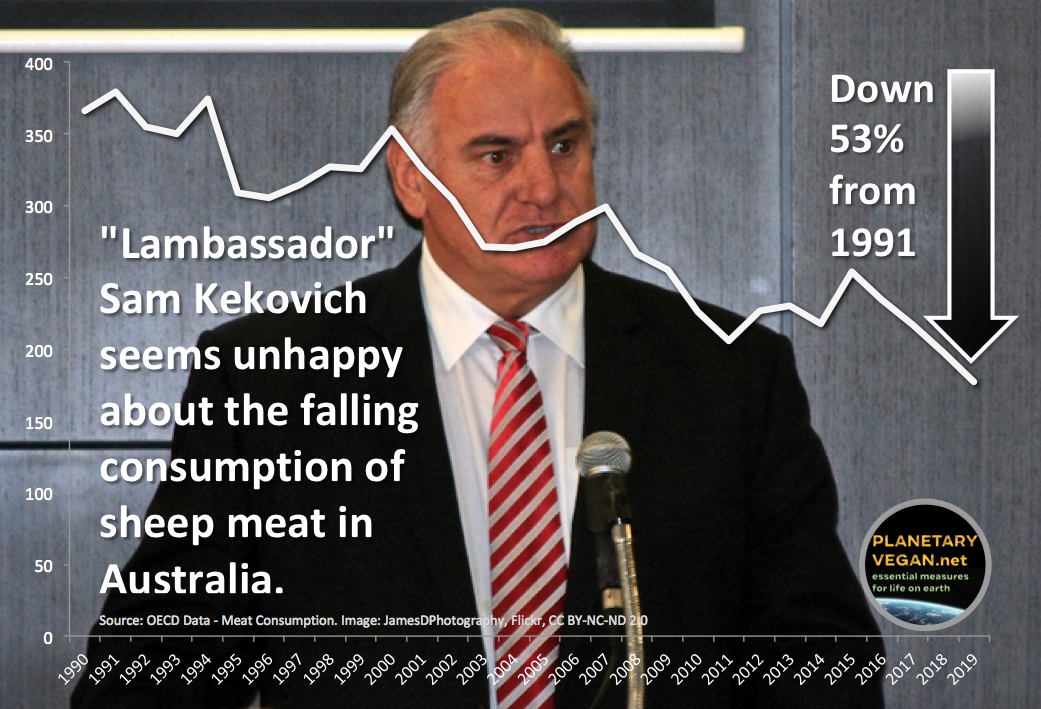
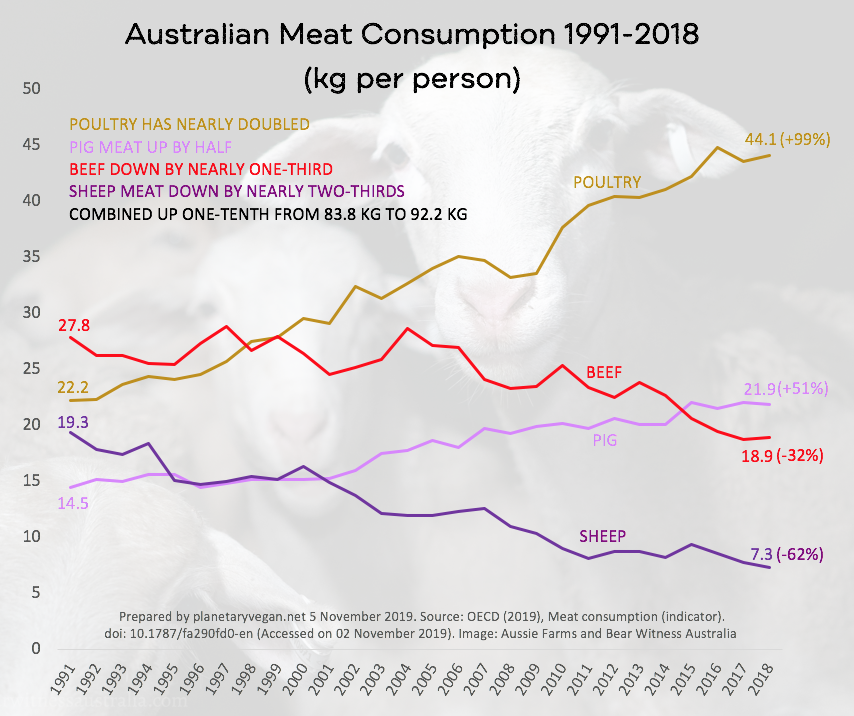
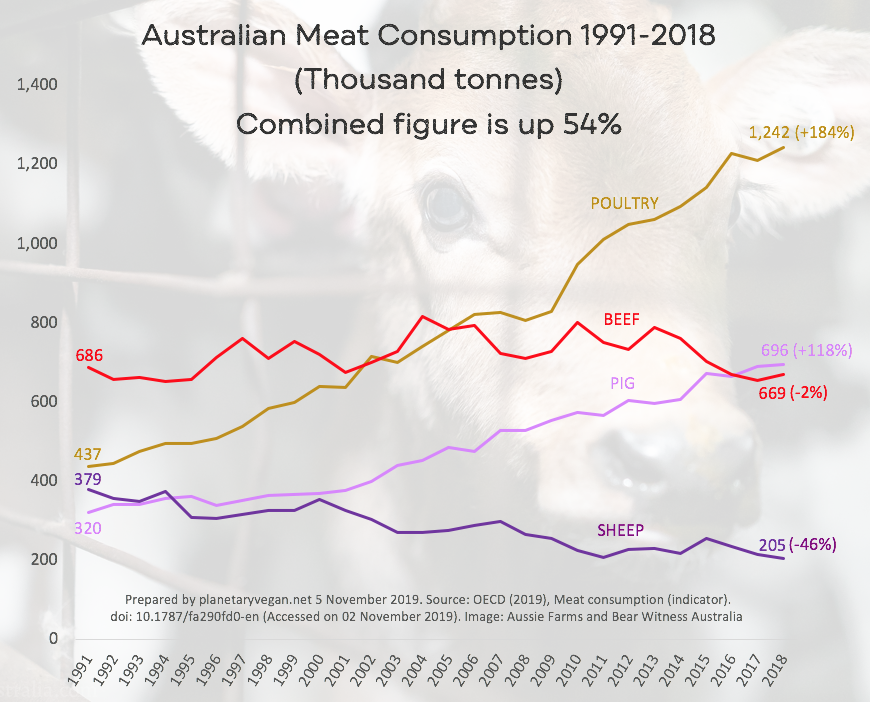
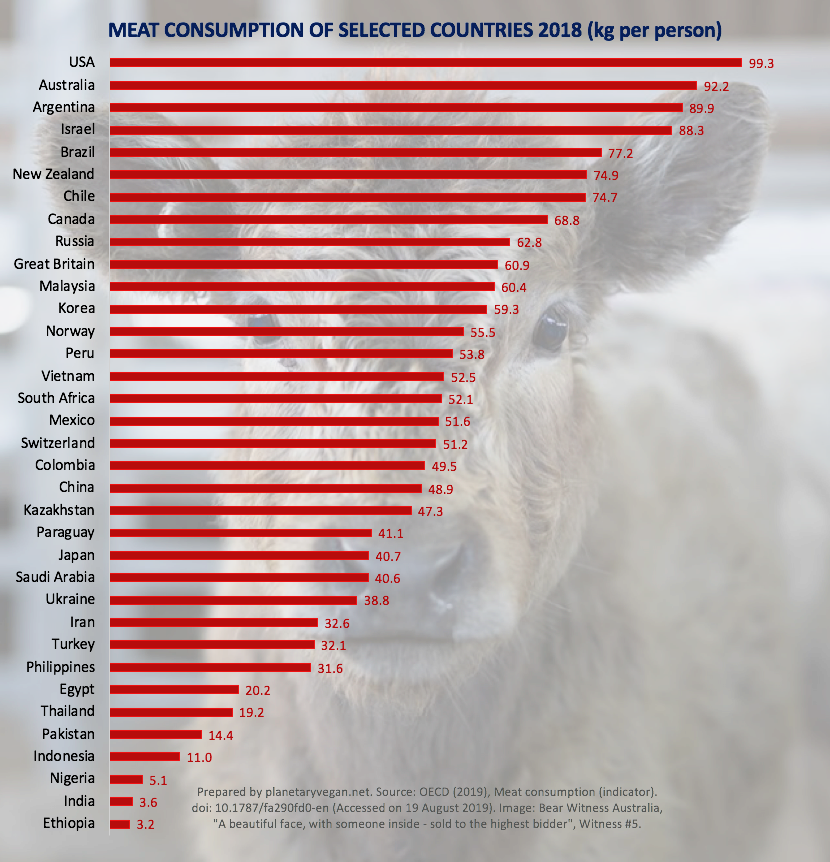
MEAT CONSUMPTION

Our government wants Australia to become “the healthiest nation on earth, with the longest life expectancy” by pursuing a “‘national mission’ that harnesses genetic and precision medicine innovations” (James Massola & Adam Gartrell, Sydney Morning Herald, 30 Jan 2018). Instead of focusing on medical research at the expense of animals, why not do something about this?

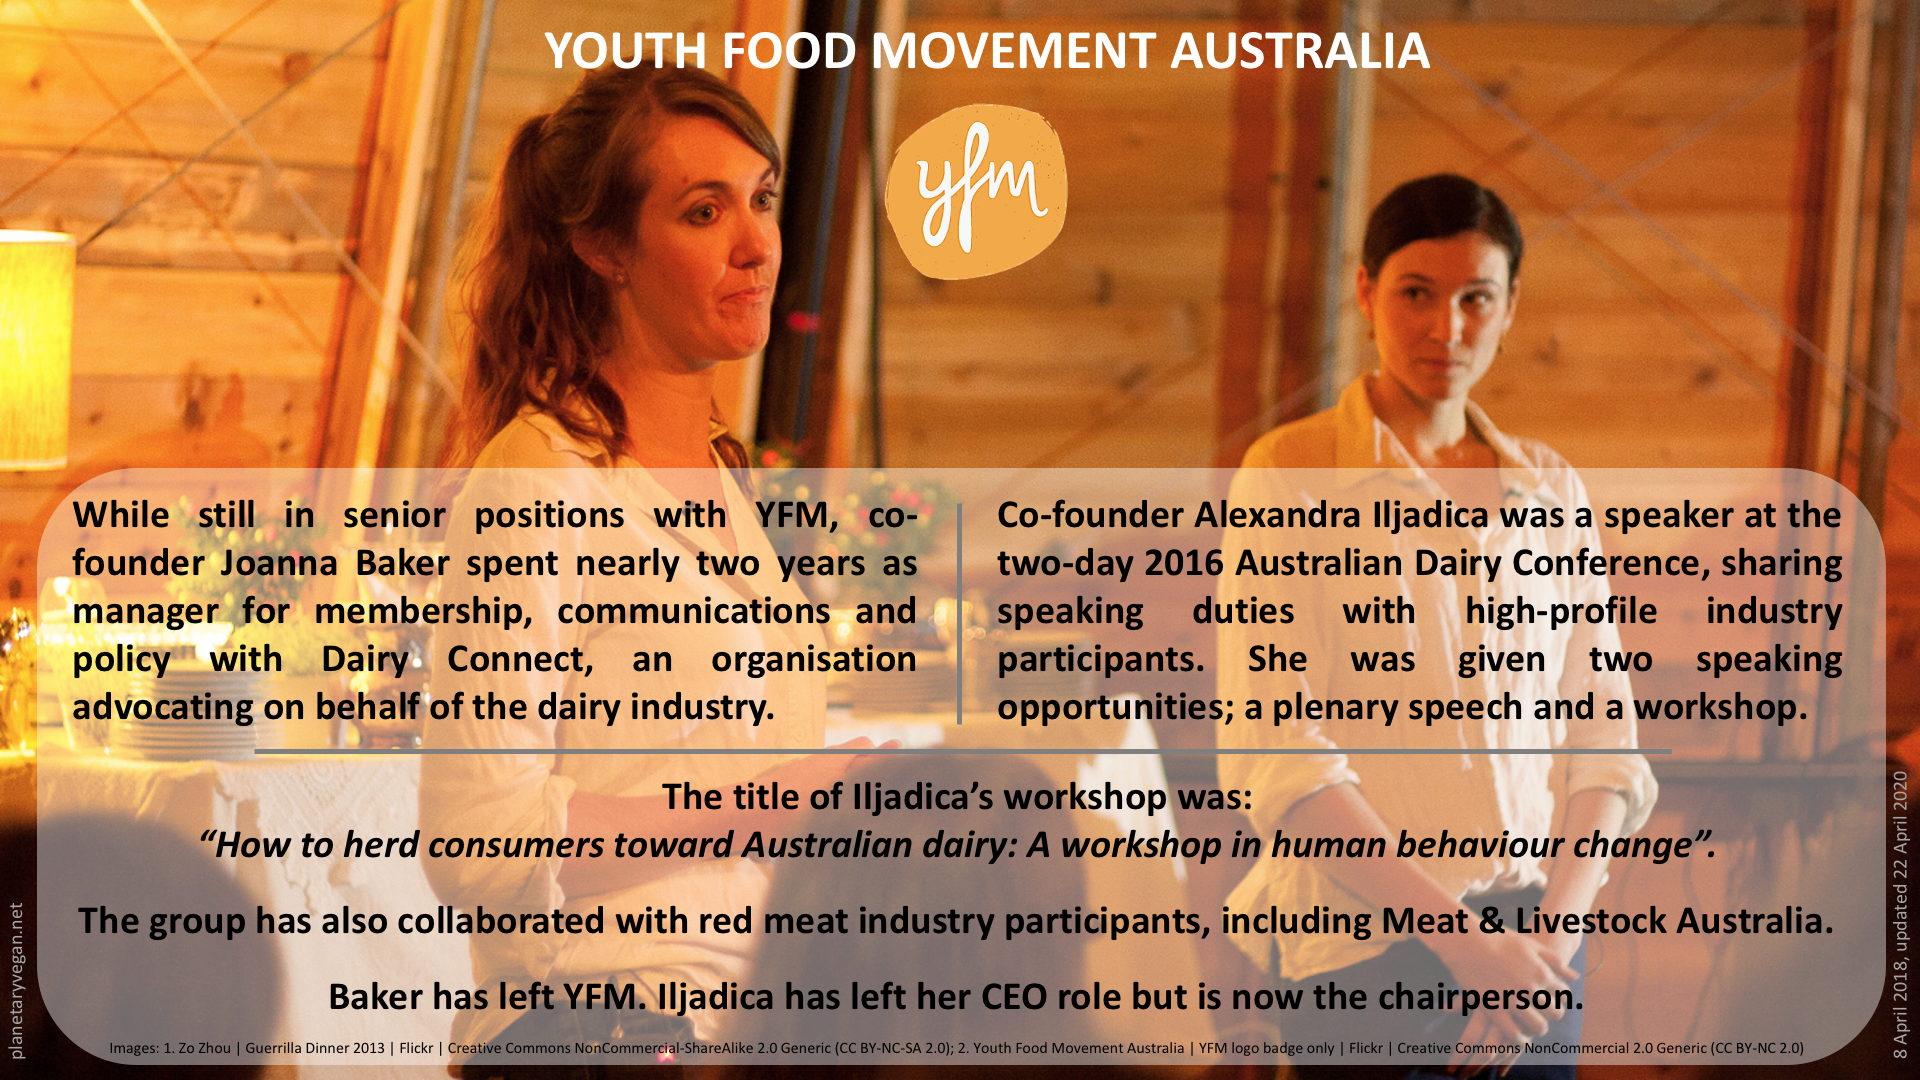
YOUTH FOOD MOVEMENT AUSTRALIA


![]()

Featured Image
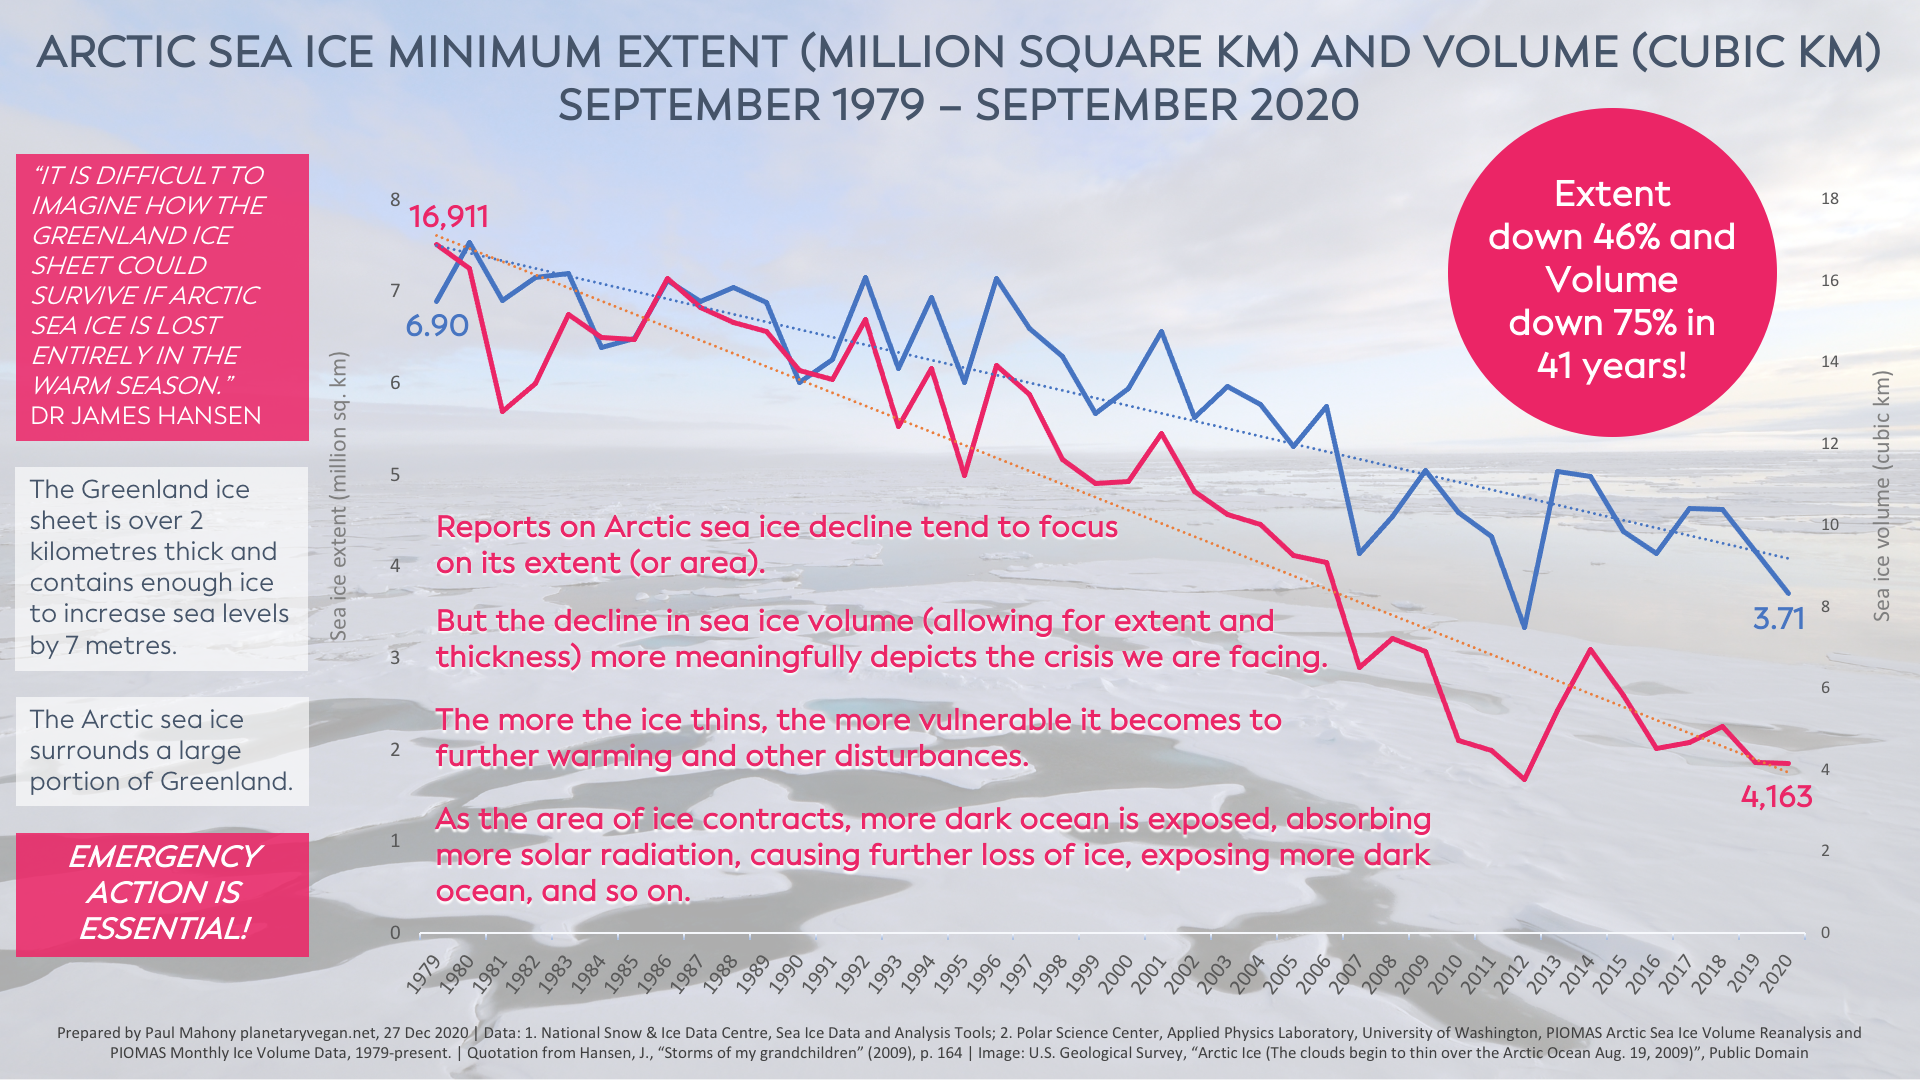
Image: U.S. Geological Survey, “Arctic Ice (The clouds begin to thin over the Arctic Ocean Aug. 19, 2009)”, Public Domain
