A key factor in considering climate change is the global warming potential (GWP) of the various greenhouse gases.
Under the United Nations Framework Convention on Climate Change (UNFCCC), the emissions of different gases are aggregated for measurement purposes by converting them to “carbon dioxide equivalent” (CO2-e). It is analogous to converting several different currencies to a common denomination.
The gases are converted to CO2-e by multiplying the mass of emissions by the relevant GWP, representing the warming impact of a unit mass of the gas relative to that of CO2 over a specific period.
Over a 100-year time horizon, the multiplier for methane (CH4) is 28 before allowing for the effect of climate-carbon feedbacks, and 34 with those feedbacks. The corresponding figures for nitrous oxide (N2O) are 265 and 298. [1]
Figures 1(a) and (b) compare the effects of one-off emission pulses of CO2, CH4 and N2O. [2] The size of each pulse reflects the amount of the relevant gas required to achieve the same level of warming as one tonne of N20 (the most potent of the three) over a 100-year time horizon. Up to the 100-year point, the area under each curve is equal, indicating an equal amount of warming. [Footnote 1]
The focus of the charts is the timing, with CH4’s impact being far more pronounced than that of the other two gases in the early period but then quickly falling away.
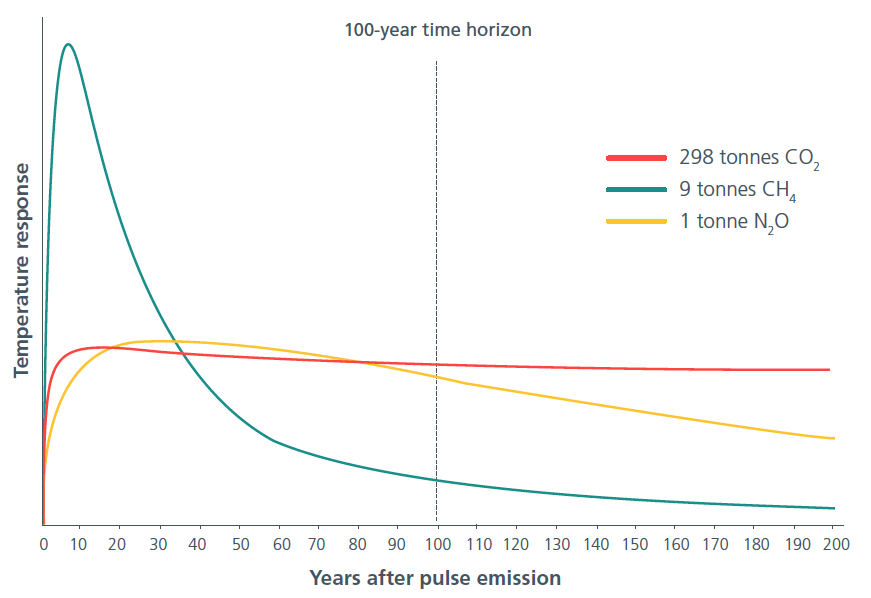
Figure 1(a): Global temperature effects of one-off emissions of carbon dioxide, methane and nitrous oxide released in year zero – combined chart.

Figure 1(b): Stand-alone charts up to 100 years adapted from Figure 1(a). The area under each curve is equal, indicating an equal temperature impact over the 100-year time horizon.
Because of CH4’s pronounced impact in the early stages following its release, a 20-year (or shorter) GWP may be more valid than the more widely used 100-year figure for the purpose of considering tipping points and critical feedback mechanisms potentially leading to runaway climate change.
If figure 1 were based on 20 years rather than 100, it would show that a single CH4 pulse of only 3.5 tonnes would have the same impact as 268 tonnes of CO2 and 1 tonne of N2O.
Emissions from animal agriculture
The issue is particularly relevant to emissions from animal agriculture. Over a 100-year time horizon, CH4 emissions represent around 44 per cent of the sector’s total emissions. [3] Its share would increase to over 70 per cent if measured on a 20-year basis, with a resultant increase in animal agriculture’s share of overall emissions. [Footnote 2]
Perhaps even more important, reduced CH4 emissions would provide rapid benefits while essential infrastructure required to transition us from fossil fuels was established.
IPCC recognises validity of shorter time horizons
There is no firm requirement to use a 100-year time horizon. The Intergovernmental Panel on Climate Change (IPCC) has stated:
“There is no scientific argument for selecting 100 years compared with other choices . . . The choice of time horizon is a value judgement because it depends on the relative weight assigned to effects at different times.” [4]
An alternative GWP estimate
The charts appearing in this article are based on the IPCC’s current estimated GWPs. Scientists from NASA’s Goddard Institute for Space Studies (GISS) have estimated GWPs for CH4 of up to 33 for 100 years [5] and up to 105 for 20 years [6].
NASA’s figures, which would show an even more pronounced spike for CH4 than shown in Figures 1(a) and (b), take into account the effects of aerosol responses. Aerosols are airborne particulates or droplets. They occur naturally and from human activity, and include sulphates, nitrates, and dust from smoke and manufacturing.
Conclusion
Although we must not ignore the long-lived nature of CO2, we must also recognise the dramatic short-term impacts of CH4 if we are to have any chance of overcoming the climate crisis.
Author
Footnotes
- Assumed calculation: N2O GWP100 of 298 / CH4 GWP100 of 34 = 8.76 (rounded up to 9)
- N2O is also prominent in animal agriculture, representing nearly 30 per cent of emissions.
References
[1] Myhre, G., D. Shindell, F.-M. Bréon, W. Collins, J. Fuglestvedt, J. Huang, D. Koch, J.-F. Lamarque, D. Lee, B. Mendoza, T. Nakajima, A. Robock, G. Stephens, T. Takemura and H. Zhang, 2013: “Anthropogenic and Natural Radiative Forcing. In: Climate Change 2013: The Physical Science Basis. Contribution of Working Group 1 to the Fifth Assessment Report of the Intergovernmental Panel on Climate Change” , Table 8.7, p. 714 [Stocker, T.F., D. Qin, G.-K. Plattner, M. Tignor, S.K. Allen, J. Boschung, A. Nauels, Y. Xia, V. Bex and P.M. Midgley (eds.)]. Cambridge University Press, Cambridge, United Kingdom and New York, NY, USA, http://www.ipcc.ch/report/ar5/wg1/
[2] Parliamentary Commissioner for the Environment (New Zealand), “Farms, forests and fossil fuels: The next great landscape transformation?”, March 2019, Figure 4.1, p. 100, citing Reisinger, A. 2018. The contribution of methane emissions from New Zealand livestock to global warming. Report to the Parliamentary Commissioner for the Environment. https://www.pce.parliament.nz/publications/farms-forests-and-fossil-fuels-the-next-great-landscape-transformation and https://www.pce.parliament.nz/media/196523/report-farms-forests-and-fossil-fuels.pdf
[3] Gerber, P.J., Steinfeld, H., Henderson, B., Mottet, A., Opio, C., Dijkman, J., Falcucci, A. & Tempio, G., 2013, “Tackling climate change through livestock – A global assessment of emissions and mitigation opportunities”, Food and Agriculture Organization of the United Nations (FAO), Rome, Fig. 4, p. 17, http://www.fao.org/ag/againfo/resources/en/publications/tackling_climate_change/index.htm; http://www.fao.org/docrep/018/i3437e/i3437e.pdf
[4] Myhre, G., et al., op. cit., pp. 711-712.
[5] Sanderson, K, “Aerosols make methane more potent”, Nature, Published online 29 October 2009, doi:10.1038/news.2009.1049; http://www.nature.com/news/2009/091029/full/news.2009.1049.html
[6] Shindell, D.T.; Faluvegi, G.; Koch, D.M.; Schmidt, G.A.; Unger, N.; Bauer, S.E. “Improved Attribution of Climate Forcing to Emissions”, Science, 30 October 2009; Vol. 326 no. 5953 pp. 716-718; DOI: 10.1126/science.1174760, http://www.sciencemag.org/content/326/5953/716.figures-only
Featured image
djhayazaa, Shutterstock ID 1718232061, Earth in the space. Blue planet for wallpaper. Green planet or Globe on galaxy. Elements of this image furnished by NASA.
Additional Notes
- The author has also used Figure 1(a) in the article “Is a methane cloud hanging over New Zealand’s zero carbon law?“, which also considers alternatives to the conventional GWP measure.
- This article has been prepared for the Climate Save Movement in addition to this site.
